


Revision 14
89
August 02, 2019
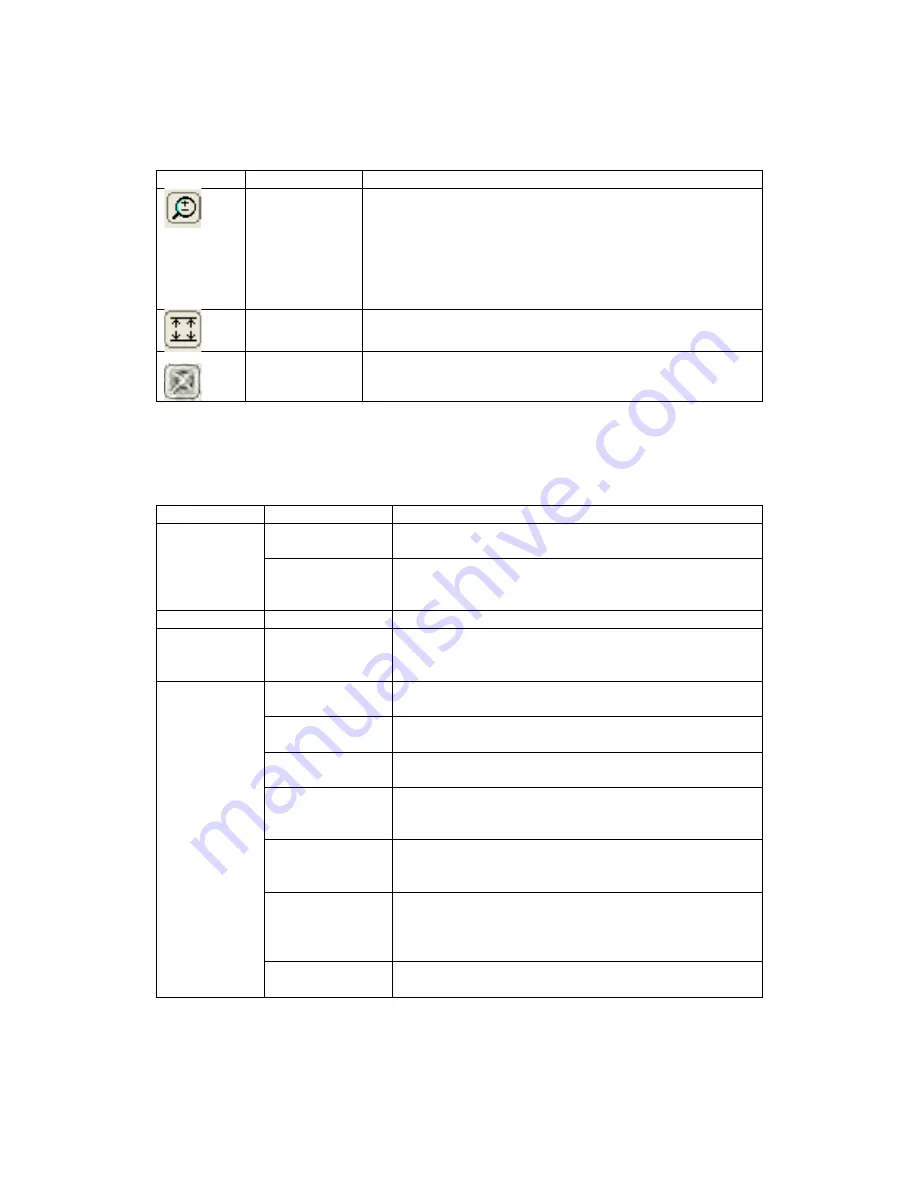
Table 5-7: Chart Button Functions
Button
Name
Function
Zoom Mode
Toggles Zoom mode on and off. When the button is
clicked, left clicking on the chart will zoom in on a section
of the chart, centered on the clicked location. Right
clicking will zoom out on a section of the chart, again
centered on the clicked location. When zoomed in on the
data, the user can scroll left, right, up and down using the
arrow keys on the computer keyboard.
Auto-Scale
Automatically adjusts the y-axis scale so that all data
within the zoomed in selection can be seen.
Show Entire
Graph
Cancels all zooms and returns to the auto-scaled graph
originally produced when the data was first graphed.
A pop-up menu with the functions indicated in Table 5-8 can be accessed by right clicking on
the chart.
Table 5-8: Chart Manipulation Options
Menu Option Sub-options
Function
Set Scale
Scale to Data
Scales the y-axis to the data. This is the default
scaling when a graph is first made.
Scale Manually
Brings up a dialogue box that allows the user to set
the minimum and maximum value for the y-axis
scale.
N/A
Prints the chart to the printer of the user’s choice
Copy to
Clipboard
N/A
Copies the chart to the clipboard as an image to
allow the user to paste it into another application,
such as Microsoft ® Word ™
Preferences
Set Trace
Colour
Allows the user to set the colours used for both the
data and the statistics lines on the chart.
Set Background
Colour
Allows the user to set the chart’s background colour.
Reset Default
Colours
Resets all colours to their defaults: red for data, blue
for statistics, and grey for the background.
Invert Scrolling
When this option is selected, inverts the function of
the arrow keys while zoomed in on data (i.e. down
key moves up, left moves right, etc).
Print Orientation Allows the operator to select whether the chart will
be printed in landscape or portrait mode. The default
is landscape.
Print Sizing
Allows the operator to select whether the printed
chart will be scaled to fit the selected size of paper,
or kept in the on-screen proportions. The default is
scaled to fit.
Show Statistics
Toggles statistics labels on the chart on and off. The
default is on.
Содержание ProTech903
Страница 2: ......
Страница 96: ...Revision 14 96 August 02 2019 Figure 5 19 Event Log...
Страница 122: ...Revision 14 122 August 02 2019 Figure 5 38 Typical Modicon with Floating Point List...
Страница 124: ...Revision 14 124 August 02 2019 Figure 5 40 Expanded Modbus Nodes...
Страница 167: ...Revision 14 167 August 02 2019 Figure 9 1 DC Power Wiring Diagram Figure 9 2 AC Power Wiring Diagram...
Страница 168: ...Revision 14 168 August 02 2019 Figure 9 3 Total Sulfur Wiring Diagram Figure 9 4 AC DC Power Wiring Diagram...
Страница 169: ...Revision 14 169 August 02 2019 Figure 9 5 Solenoid Drivers Wiring Diagram Figure 9 6 Relays Wiring Diagram...
Страница 173: ...Revision 14 173 August 02 2019 Figure 9 13 Isolated RS 485 Port Figure 9 14 P17 RS232 Port to Ethernet Cable...
Страница 175: ...Revision 14 175 August 02 2019 Figure 9 17 Non Isolated 4 20 mA Inputs...
Страница 190: ...Revision 14 190 August 02 2019...


