60
Instruction Manual IM02602008E - Rev. D
Transformer Temperature Controllers
IM02602008E - Rev. D May 2019 www.eaton.com
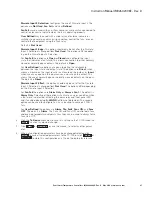
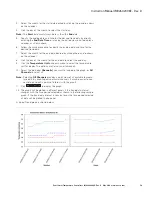
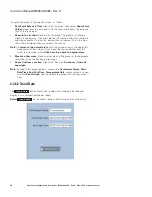
Navigate the graph to find specific values, as follows:
1.
Data Point Date and Time
. Right click the graph, then select
Show Point
Values
. Hover over the data point with the mouse to display the date and
time of that data point.
2.
Zoom In to a sectione:
Double click the graph. The graphic will change
slightly in appearance. Click and hold the left mouse button then drag it to
one side or another. Two vertical dotted lines will appear. This is the area
that will be enlarged when you release the mouse.
otee:
N
To
return to the normal view
, click the curved arrow in the upper left-
hand corner of the screen. (If you hover the mouse pointer over this
arrow the message will be
Click here to go back to original view
).
3.
Move to other arease:
Move to other areas of the graph (at the zoomed-in
resolution) using the Keyboard arrow keys,
4.
Zoom Out from a sectione:
Right click then click
Un-zoom
or
Undo all
zoom/pan
.
otee:
N
To modify the graph contents, change the
Transformer Name
,
Start
Date Time
,
End Date Time
,
Temperature Unit
, and/or channels to view
and click
Show Graph
again to update the graph with the new selec-
tions.
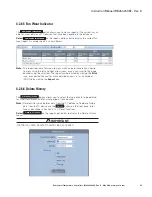
4.2.6.2 Trend Data
The
Trend Data
option allows you to select the trend data desired and
display it as a spreadsheet/tabular report.
Select
Trend Data
on the reports options bar to display the set up menu.


