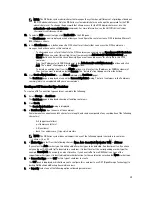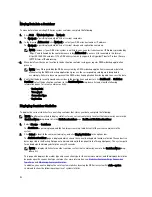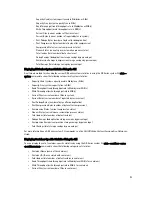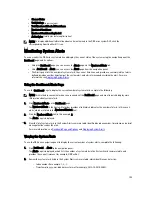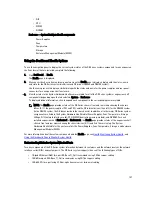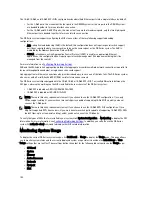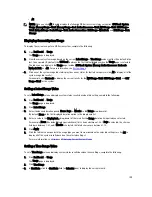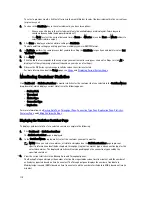
listed under the corresponding table column. Depending upon the number of check boxes you select, you
may need to use the horizontal scroll bar to display all of the statistics columns.
3.
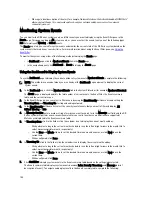
In the Replication Filter pane, select any of the following Container Filter choices for which you want to display your
choice of replication statistics:
– Click All—this displays replication statistics for all of the currently configured containers on the system.
– Click Name, and select an individual container in the Name drop-down list—this displays replication
statistics for a single container. To display more than one container, click Ctrl in the Name drop-down list,
and select any additional containers you want to include.
– Click Peer System, and select an individual peer DR Series system in the Peer System list box—this
displays replication statistics for a single peer system. To display more than one peer system, click Ctrl in
the Peer System list box, and select any additional peer systems you want to include.
4.
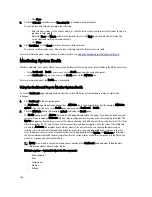
In the Replication Filter pane, select from the following Headers check boxes that you want to filter and display in
the Replication statistics summary table for the selected container(s):
NOTE: Source systems running different DR Series system software versions (for example, one system with
1.0.1.2 software and another system with 1.1.1.0 software), will display some minor replication statistics
differences in the Containers: Statistics and Statistics: Replication pages due to the difference of the system
software version used on the source appliance.
– Peer Status—indicates the current peer status (Insync, Paused, or Replicating).
– Replication Status—indicates the current replication status (Offline, Online, Disconnected, Trying to
Connect, or Stopped).
– Time to Sync—indicates the time until system synchronization (in days/hours/minutes/seconds).
– Progress (%)—indicates the current replication progress by percentage.
– Replication Throughput—indicates the current replication throughput by percentage (%).
– Network Throughput—indicates the current network throughput by percentage.
– Network Savings—indicates the current network savings using replication by percentage.
– Last Time in Sync—indicates the last time system synchronization occurred.
– Peer Container—indicates the peer container in the replication relationship.
– Peer System—indicates the IP address of the peer system in the replication relationship.
For more information, see
Displaying the Statistics: Replication Page
.
Creating a Replication Schedule
Replication schedules can only be set on individual replication-enabled source containers. To create a Replication
schedule on a replication-enabled source container, complete the following:
NOTE: If there is no Replication schedule set, but there is pending data that can be replicated, replication will run
when it detects the following: 1) there are no active data ingests, and 2) five minutes of system idle time have
elapsed since the last data file ingest completed.
NOTE: The Replication Schedule page displays the current DR Series system time zone and current timestamp
(using this format: US/Pacific, Tue Oct 28 14:53:02 2012.
To schedule Replication operations on your system, complete the following:
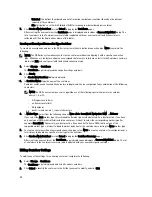
1.
Select Schedules
→
Replication Schedule.
The Replication Schedule page is displayed.
2.
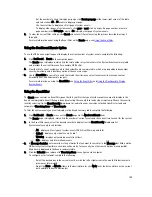
Click to select the replication-enabled source container in the Container drop-down list.
The Replication schedule table is displayed with columns that identify the week day, start time, and stop time.
3.
Click Schedule to create a new schedule (or click Edit Schedule to modify an existing Replication schedule).
98
Содержание PowerVault DX6112
Страница 1: ...Dell DR Series System Administrator Guide ...
Страница 32: ...32 ...
Страница 70: ...70 ...
Страница 86: ...86 ...
Страница 100: ...For more information on Replication schedules see Creating a Replication Schedule 100 ...
Страница 114: ...114 ...

