•
All
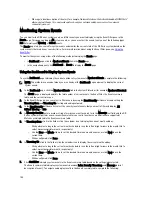
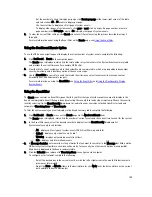
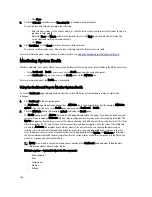
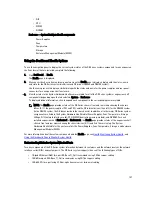
NOTE: When you click All, this tab displays the following DR Series system status categories: CPU Load, System
Usage, Memory Usage - Total, Memory Usage - Real, Active Processes - Total, NFS Usage - Total, CIFS Usage -
Total, Network Usage, Socket Usage - Total, Active Connections, Disk Usage - Meta Data, and Disk Usage - Data
Storage.
Displaying Current System Usage
To display the current usage for a DR Series system, complete the following:
1.
Click Dashboard
→
Usage.
The Usage page is displayed.
2.
View the current system usage based on the current Latest Range or Time Range values in effect (the default is the
last 1-hour period). By default, the CPU Load is always the first tab that displays when the Usage page is selected.
The tabs you can display in the Usage page include: CPU Load, System, Memory, Active Processes, Protocols,
Network, Disk, and All. For more information, see
System Usage
.
3.
Click any of the system usage tabs to display the current status for that tab category (or click All to display all of the
system usage tab results).
For example, click Protocols to display the current results for the NFS Usage - Total, CIFS Usage - Total, and OST
Usage - Total for the system.
Setting a Latest Range Value
To set a Latest Range value and display system status results based on this setting, complete the following:
1.
Click Dashboard
→
Usage.
The Usage page is displayed.
2.
Click Latest Range.
3.
Select the desired duration period (Hours, Days, or Months) in the Range drop-down list.
By default, Hours is the first displayed duration option in the drop-down list.
4.
Select a value in the Display last... drop-down list that matches the Range duration time period you selected.
For example, Hours (the default display period shown) lists choices between 1-24. If Days is selected, the choices
listed are between 1-31, and if Months is selected, the listed choices are between 1-12.
5.
Click Apply.
6.
Click the tab that corresponds to the usage type you want to view based on the selected settings (or click All to
display all of the system results based on the selected settings).
For more information, see
Usage
and
Displaying Current System Usage
.
Setting a Time Range Value
To set a Time Range value and display system status results based on these settings, complete the following:
1.
Click Dashboard
→
Usage.
The Usage page is displayed.
2.
Click Time Range.
3.
In Start Date, click the Start Date field (or Calendar icon) to display the current month.
109
Содержание PowerVault DX6112
Страница 1: ...Dell DR Series System Administrator Guide ...
Страница 32: ...32 ...
Страница 70: ...70 ...
Страница 86: ...86 ...
Страница 100: ...For more information on Replication schedules see Creating a Replication Schedule 100 ...
Страница 114: ...114 ...

