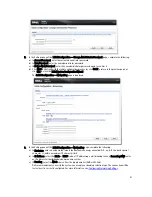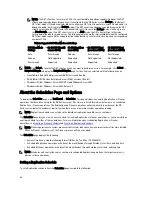
tab displays a Duplication Statistics pane with the following Inbound and Outbound categories: Bytes Copied
(logical), Bytes Transferred (actual), Network Bandwidth Savings, Current Count of Active Files, and Replication
Errors. In addition, this tab also displays a Recent Number of Optimized Copies table, that lists the file name,
peer IP, peer ID, logical bytes to send, replication rate, savings, and replicated at location. The Client Statistics
tab displays a Client Statistics pane with the following categories: Images Ingested, Images Complete, Images
Incomplete, Images Restored, Bytes Restored, Image Restore Errors, Image Ingest Errors, Bytes Ingested, Bytes
Transferred, and Network Savings.
•
(Optional) Replication pane: displays the Replication Configuration and Replication Status panes. The
Replication Configuration pane identifies whether the current container state (Enable or Disable), Role (source
or target), Remote Container Name, Bandwidth, and the Encryption being used. The Replication Status pane
identifies the Peer State, Replication State, Replication Average Transfer Rate, Replication Peak Transfer Rate,
Network Average Transfer Rate, Network Peak Transfer Rate, Network Bytes Sent, Estimated Time to Sync (in
days, hours, minutes, and seconds), Savings (in percentage), Last Insync Time (in timestamp format), and
Schedule Status.
NOTE: The Replication pane is only displayed in the Statistics: Container page if the selected container is
configured for replication.
Backup Data Pane
The Backup Data pane in the Statistics: Container page displays the following graphed information:
•
Current number of active files ingested (based on time in minutes)
•
Current number of active bytes (Mebibytes/MiB) ingested (based on time in minutes)
You can choose to display this information in 1–hour (1h), which is the default, or in 1–day (1d), 5–day (5d), 1–month (1m),
and 1–year (1y) increments for both the Active Files and Active Bytes graphs.
NOTE: To refresh the values listed in Backup Data and Throughput panes, click
.
Throughput Pane
The Throughput pane in the Statistics: Container page displays the following statistics for any existing container that you
select in the Container Name drop-down list:
•
Current number of Mebibytes/per second (MiB/s) for read operations (based on time/minutes)
•
Current number of MiB/s for write operations (based on time/minutes)
NOTE: To refresh the values listed in Backup Data and Throughput panes, click
.
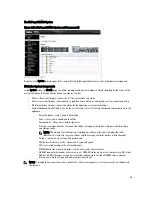
Replication Pane
The Replication section in the Statistics: Container page consists of two panes: Replication Configuration and
Replication Status. This section of this page is only displayed when there are replication statistics for a selected
container that has been configured for replication.
Replication Configuration Pane
This pane contains the following fields:
•
Enable (for example, Yes or No)
•
Role (for example, Source or Target)
•
Remote Container Name (for example, IP Address or hostname)
•
Bandwidth (for example, Default, KiB/s, MiB/s, and GiB/s)
•
Encryption (for example, None, AES 128–bit, or AES 256–bit)
54
Содержание PowerVault DX6112
Страница 1: ...Dell DR Series System Administrator Guide ...
Страница 32: ...32 ...
Страница 70: ...70 ...
Страница 86: ...86 ...
Страница 100: ...For more information on Replication schedules see Creating a Replication Schedule 100 ...
Страница 114: ...114 ...

