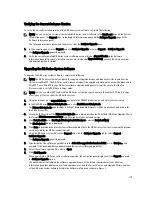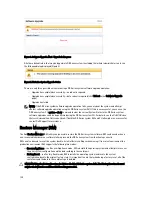
To select a previous month, click the left arrow in the month title bar to select the desired month in the current year
(or previous year).
4.
To choose the Start Date day in the selected month, you have two options:
– Choose a specific day in the selected month (only the available days are displayed). Future days are
considered unavailable (and appear dimmed out).
– Click Now to select the current date and time in Hours and Minutes (or use the Hour and Minute sliders to
select a desired time value).
5.
Click Done to display your date and time settings in Start Date.
The date and time settings you set appear in an mm/dd/yyyy hh:mm AM/PM format.
6.
In End Date, perform the same process that you did for setting the Start Date to specify an end date (or select Set
“End Date” to current time).
7.
Click Apply.
8.
Click the tab that corresponds to the usage type you want to monitor using your choice of settings (or click All to
display all of the system usage tab results based on your choice of settings).
9.
Observe the DR Series system usage results based on the criteria selected.
For more information about the Usage page, see
Usage
and
Displaying Current System Usage
.
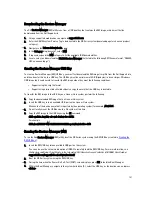
Monitoring Container Statistics
Click Dashboard
→
Statistics: Container to monitor statistics for the container that you selected in the Container Name:
drop-down list, which displays current statistics in the following panes:
•
Backup Data
•
Throughput
•
Marker Type
•
Connection Type
•
Replication
For more information, see
Backup Data Pane
,
Throughput Pane
,
Connection Type Pane
,
Replication Pane
,
Statistics:
Container Page
, and
Editing Container Settings
.
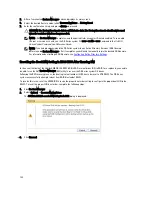
Displaying the Statistics: Container Page
To display container statistics for a selected container, complete the following:
1.
Click Dashboard
→
Statistics: Container.
The Statistics: Container page is displayed.
2.
In the Container Name: drop-down list, select the container you want to monitor.
NOTE: When you select a container, all statistics displayed on the Statistics: Container page represent
specific information about the backup data, throughput, replication, marker type, and connection type for the
selected container. The displayed statistics will vary depending upon the connection type used by the
specified container.
3.
View the current statistics in the Backup Data and Throughput panes.
The Backup Data pane displays the number of active files ingested based on time (in minutes), and the number of
active bytes ingested based on time (in minutes). The Throughput pane displays the number of read data in
Mebibytes/per second (MiB/s) based on time (in minutes), and the number of write data in MiB/s based on time (in
minutes).
110
Содержание PowerVault DX6112
Страница 1: ...Dell DR Series System Administrator Guide ...
Страница 32: ...32 ...
Страница 70: ...70 ...
Страница 86: ...86 ...
Страница 100: ...For more information on Replication schedules see Creating a Replication Schedule 100 ...
Страница 114: ...114 ...

