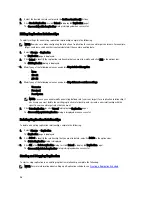
– Click Done.
5.
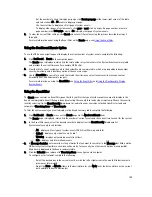
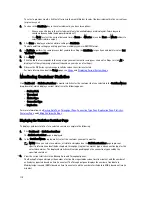
Click the Calendar icon (adjacent to Timestamp To) to configure an end setpoint.
To configure an end setpoint, complete the following:
– Select the desired day in the current month, or click the left or right arrow in the month title bar to select a
previous or later month.
– Adjust the Hour and Minute sliders to the desired time (or click Now to set the date and time to be the
current date and time in hours and minutes).
– Click Done.
6.
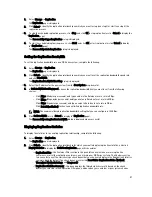
Click Start Filter (or click Reset to return all values to default values).
The search results based on your filter choices are displayed in the Events summary table.
For more information about using the Events summary table, see
Using the Dashboard to Display System Events
.
Monitoring System Health
Monitor and display the current state of your system hardware status using one of two methods in the DR Series system:
•
Using Dashboard
→
Health , you can access the Health page from the navigation panel.
•
In the Dashboard page, you can access the Health page via the HW State link.
For more information about the Health page, see
Health
.
Using the Dashboard Page to Monitor System Health
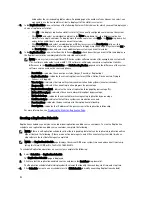
To use the Dashboard page to display and monitor the current DR Series system hardware status, complete the
following:
1.
Click Dashboard in the navigation panel.
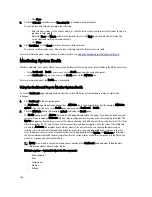
The Dashboard page is displayed and provides a HW State link in the System Status bar (for example, HW State:
optimal). (You can also access the Health page when you click Dashboard
→
Health.)
2.
Click the HW State link (in this example, optimal) to display the Health page.
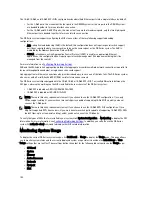
The Health page provides a System tab, which is the default displayed on this page. If you have installed one, your
system will also include an Enclosure tab (this release supports up to two expansion shelves being installed). The
System tab displays front and rear views of the chassis showing the disk drive locations in the front view (0–11), the
OS internal drives (12–13), and the fans, system connectors, and power supplies in the rear view. If installed and
clicked, the Enclosure tab displays front and rear views of the enclosure chassis showing the physical disk
locations (0–11) in the front view, and the enclosure connectors, fans, and pluggable drive locations in the rear
view. In addition, the service tag of the expansion shelf is displayed. Both the System and Enclosure tabs display
the System Hardware Health summary table that lists the current status of all major components in the DR Series
system or its expansion shelf, respectively.
NOTE: This method is convenient when you are already at the Dashboard page and want to display more
information about current System Status.
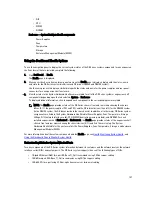
DR Series system — System Hardware Health components
– Power Supplies
– Fans
– Temperature
– Storage
– Voltage
106
Содержание PowerVault DX6112
Страница 1: ...Dell DR Series System Administrator Guide ...
Страница 32: ...32 ...
Страница 70: ...70 ...
Страница 86: ...86 ...
Страница 100: ...For more information on Replication schedules see Creating a Replication Schedule 100 ...
Страница 114: ...114 ...

