334
Delete
—Remove the selected service array from the list.
Show Key Metrics
—Displays the key metrics for the selected array. See Key Metric Editor on page
289 for more about configuring these.
Audit Trail
—Displays the audit trails for the selected storage array, as described in Audit Trail
Viewer on page 92.
For additional information, you can click the plus in the upper right corner of this portlet to see the
Storage Array Portlet Expanded.
Tip
Storage arrays also appear in the Managed Resources portlet.
Storage Array Portlet Expanded
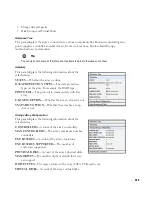
The expanded portlet displays additional information about discovered storage arrays.
The expanded portlet adds columns for
Firmware Version, Software Version, Total Capacity (GB),
Assigned Capacity (GB), Allocated Capacity (GB),
and
Exposed Capacity (GB)
.
This screen also contains several Snap panels that contain information about the listed array you
select. The first four are visible when you click their labels on the left of the screen.
• Reference Tree
• Summary
• Storage Array Configuration
• Host Access and Ports
Содержание OpenManage Network Manager
Страница 1: ...Dell OpenManage Network Manager version 5 1 Web Client Guide ...
Страница 14: ...14 A Note About Performance Preface ...
Страница 98: ...98 Schedules Portal Conventions ...
Страница 141: ...Vendors Key Portlets 141 Vendors Snap Panel The snap panel displays the icon for the selected vendor ...
Страница 142: ...142 Vendors Key Portlets ...
Страница 232: ...232 File Management File Servers ...
Страница 242: ...242 Deploy Configuration ...
Страница 290: ...290 Key Metric Editor Monitoring Metrics This panel s display depends on the selected device ...
Страница 340: ...340 ...
Страница 374: ...374 Adaptive CLI Records Archiving Policy Actions and Adaptive CLI ...
Страница 380: ...380 Glossary ...
Страница 388: ...388 388 Index ...


