Resource Monitors | Monitoring
263
Attributes available depend on the type of monitor you are creating. Notice that you can also
check to make crossing this threshold emit a notification (an alarm that would appear on the
Alarm panel). You can also configure the type of calculation, and so on. You can even alter
existing thresholds by selecting one then clicking
Edit
to the right of the selected threshold.
10
Click
Apply
for each threshold interval you configure, then
Apply
for the entire threshold
configuration.
NOTE:
If a threshold’s counter is an SNMP Counter32 (a 32-bit counter) monitoring can exceed its capacity with a
fully utilized gigabit interface in a relatively short period of time. The defaults configured in this monitor
account for this, but if you know that this is an issue, you can probably configure the monitor to account for
it too.
After taking a look at Thresholds no more configuration is required. Notice, however, that you
can also configure
Calculated Metrics
,
Inventory Mappings
and
Conditions
on other screens
in this editor to calculate additional values based on the monitored attributes, to map them,
and to make conditional properties based on monitored behavior.
Tip
Calculated Metrics
is particularly valuable if you want to monitor a composite like ifIn ifOutErrors
or want to calculate a parameter like errors per minute when you have a 5-minute monitoring interval.
11
Click
Save
and the monitor is now active.
Notice that the
Availability
icon appears at the top of a
Monitor Status Summary
snap panel
in the Expanded Resource Monitor next to a time/date stamp of its last polling. Right-click
the monitor and select
Refresh Monitor
to manually initiate polling.
Values displayed in the Overall Availability column of the Monitor Manager do not
automatically refresh and may be out of date. The
Reference Tree
snap panel maps the
monitor’s relationship to its target(s) attribute(s) and other elements. The
Details
snap panel
summarizes the monitor’s configuration.
12
For information about having the monitor’s results appear in the a
Dashboard
portlet, see
Dashboard Views
on page 277.
How To:
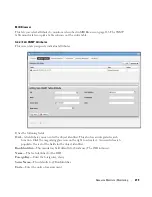
Create an ICMP Monitor
The following steps create an ICMP (ping) monitor.
1
In the
Resource Monitors
portlet, and create a new monitor by right-clicking and selecting
New
.
2
Select the type of monitor from the submenu—for this example, an
ICMP
monitor.
Содержание OpenManage Network Manager
Страница 1: ...Dell OpenManage Network Manager version 5 1 Web Client Guide ...
Страница 14: ...14 A Note About Performance Preface ...
Страница 98: ...98 Schedules Portal Conventions ...
Страница 141: ...Vendors Key Portlets 141 Vendors Snap Panel The snap panel displays the icon for the selected vendor ...
Страница 142: ...142 Vendors Key Portlets ...
Страница 232: ...232 File Management File Servers ...
Страница 242: ...242 Deploy Configuration ...
Страница 290: ...290 Key Metric Editor Monitoring Metrics This panel s display depends on the selected device ...
Страница 340: ...340 ...
Страница 374: ...374 Adaptive CLI Records Archiving Policy Actions and Adaptive CLI ...
Страница 380: ...380 Glossary ...
Страница 388: ...388 388 Index ...


