M.A.Ch.10/100 Diagnostic Analyzer 09/00
42
Protocols...
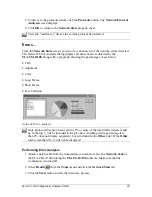
When you click the
Network
Protocols
button, a pie chart displays the protocols found.
The
Detected
Protocols
list box displays all protocols that have been detected on the
network. The pie chart displays the top five protocols (greater than 2%), including a lump
some of smaller protocols.
Network Protocol Analysis
Only protocols that have been seen for 2% or more of the total traffic detected, and
up to the top 5, will be included in the pie chart. Anything with a percentage less
than 2% does not display separately, but is included in the
Other
total. If the
Other
total is less than 2%, it will not be displayed.
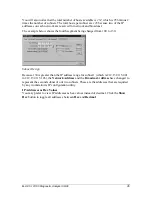
The Network Protocol Analysis dialog displays all network protocols detected by the
M.A.Ch.10/100
, along with a pie graph showing the percentages of each protocol in use:
•
IPX on 802.3
•
IPX on 802.2
•
IPX on Ethernet Type
•
IPX on SNAP
•
IP on 802.3
•
IP on SNAP
•
NETBEUI
Determining Network Protocols
From the
Network Stats
tab screen, you can view an analysis of the network protocols
detected when you click
Protocols.
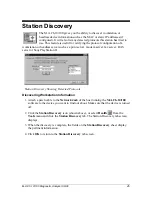
1. Attach a patch cable from the workstation you want to test to the
Network Jack
of
the M.A.CH.10/100 running the
M.A.Ch.10/100
software. Make sure that the
workstation is turned off.
2. Select
Health
from the
Tools
menu and click the
Network Stats
tab.
3. Click the
Start
button to start the discovery process.
4. As the network is polled, the “dial” on the dashboard reflects current network
utilization.
Содержание M.A.Ch.10/100
Страница 1: ...M A Ch 10 100TM Diagnostic Analyzer ...
Страница 3: ...M A Ch 10 100 Diagnostic Analyzer 09 00 iii ...


