M.A.Ch.10/100 Diagnostic Analyzer 09/00
37
If you create a new site, your current site configuration will be saved with the new
site.
As the test runs, you will see the dials move. You should let the test run for a long
enough time to capture the required amount of data for your needs.
4. Click
Stop
to end the test.
5. For more information about the data you capture, click one of the following buttons:
Histogram...
,
Talkers...
,
Protocols...
or
Errors
. See
Histogram
,
Talkers
,
Protocols
and
Errors
section for more information about these detail screens.
Histogram...
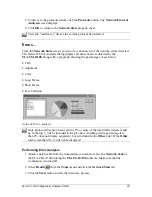
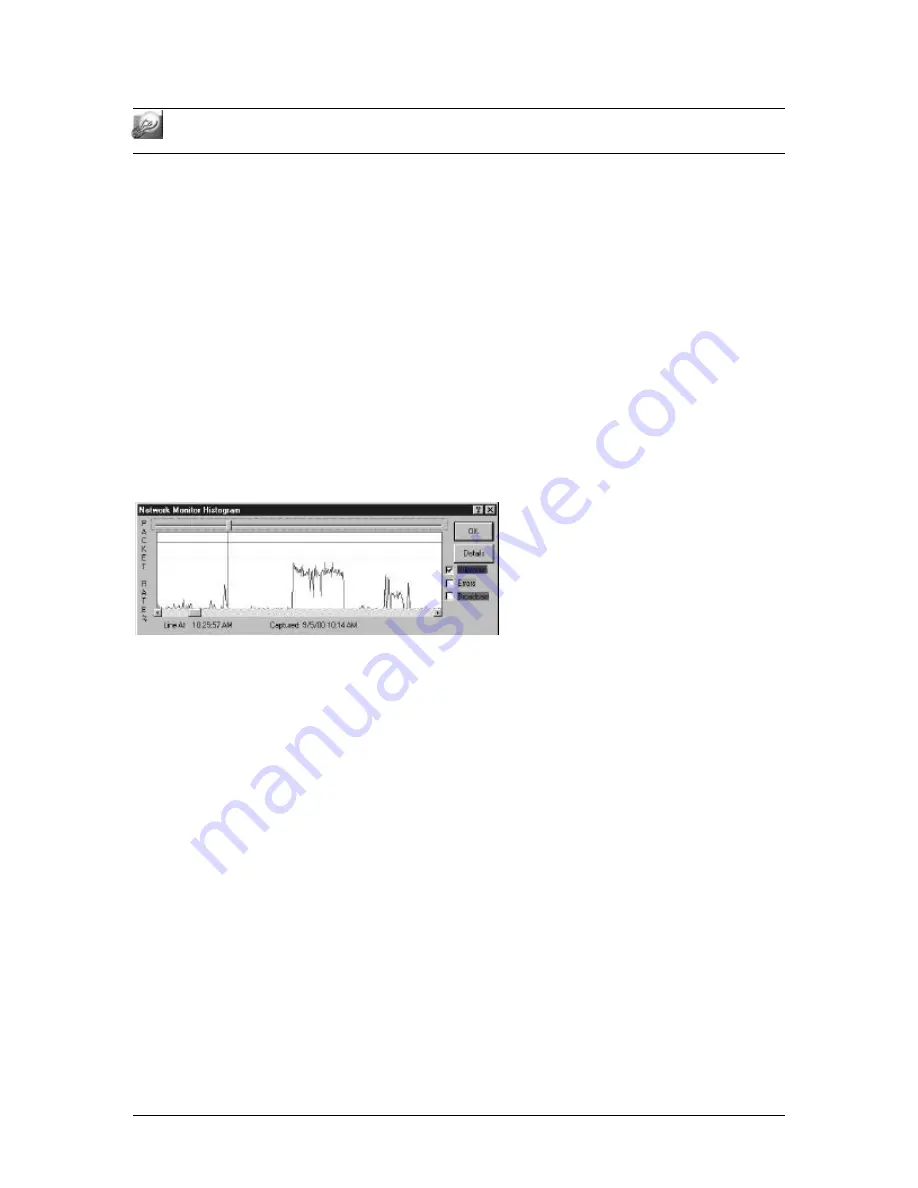
The M.A.Ch.10/100 has a histogram feature that can be used when reviewing captured
data. The feature is very useful when running extended captures, such as an overnight
capture, to determine specific network congestion problems or overly high network errors
(set under options). The
Histogram
displays graphical information about the current
captured data (live) or the data can be replayed from a previous capture (such as data run
overnight).
Network Monitor Histogram
A breakdown of
Utilization
(network activity),
Errors
(error rate) and
Broadcast
(broadcast rate) can be seen by selecting the different options on the screen. These
options can be individually turned on or off. As you select/deselect each option, the
display changes to show only the results you have selected for viewing. When only a
single option is turned on, the corresponding alarm levels will appear as bars on the
graph. The alarm level settings (green, yellow and red) for these dials are set in
Alarm
Settings
under the
Options
menu.
The slide bar at the top of the Histogram allows you to identify a particular point of in the
data where you suspect a problem is occurring. The vertical line that appears on the graph
corresponds to the slide bar located at the top of the screen. This slide bar can be
positioned exactly over the data points that you want to further examine. For example, if
you run a capture overnight, and find an unusually high utilization rate, you can use the
slide bar to select a particular data point or peak. This data point relates to the exact time
of data capture.
Once you have the slide bar positioned at the target area, press the
Details
button for
more information. The
Details
screen allows you to walk through the captured data one
time tick at a time, looking for the stations generating the traffic of interest.
Содержание M.A.Ch.10/100
Страница 1: ...M A Ch 10 100TM Diagnostic Analyzer ...
Страница 3: ...M A Ch 10 100 Diagnostic Analyzer 09 00 iii ...


