EZT-570S User Manual
21
The currently loaded program, or status of a running ramp/soak program will be displayed at the
bottom left of the screen. The Overview will also display all current alarms that have not been cleared
from the Alarm screen. The alarm field will automatically scroll through each alarm, displaying one at
a time every few seconds until all alarms have been cleared.
The
Program Operation
button displays the automatic ramp/soak program control window. This
provides access to program select, start, stop and hold functions allowing the operator to control the
program directly from the Overview screen. See section 4.3 Starting an Automatic Ramp/Soak
Program for more information.
2.3 Trends
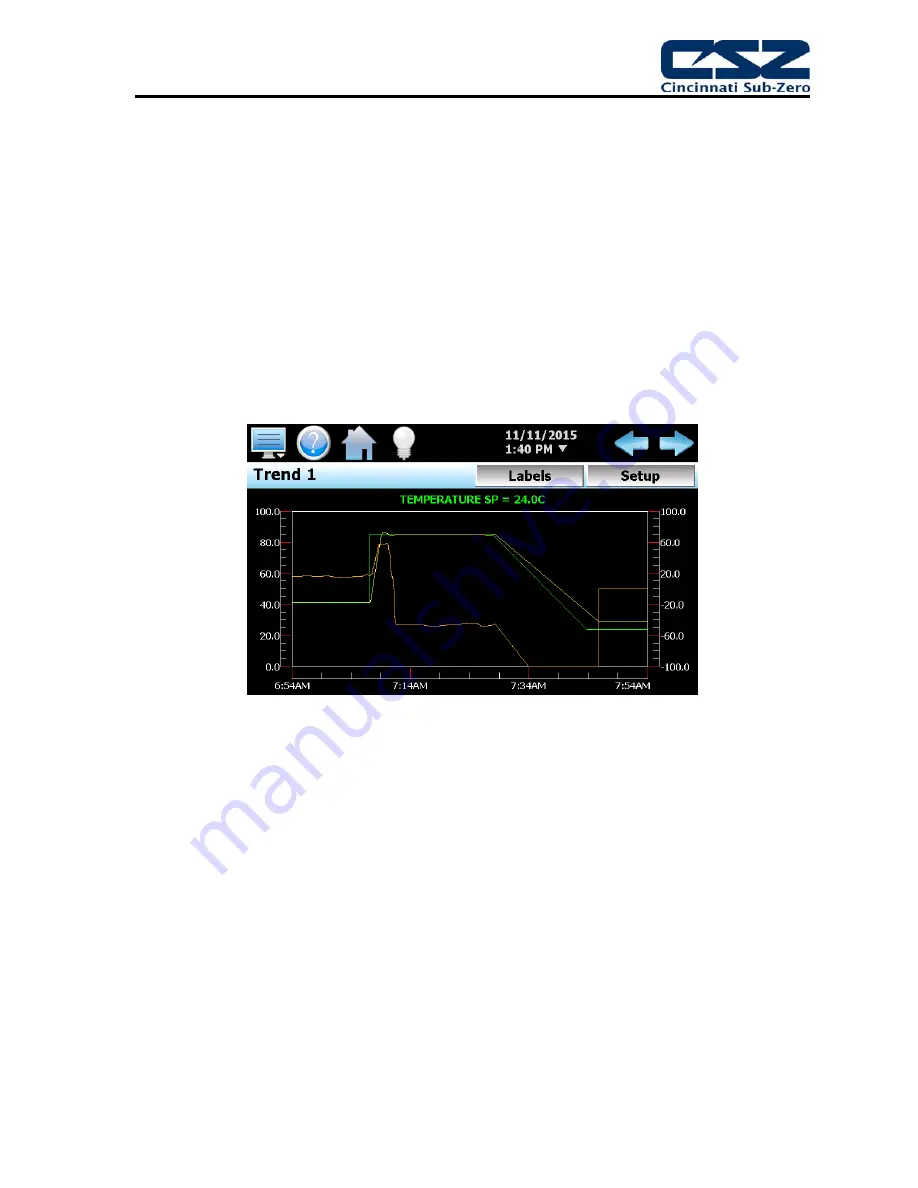
The real-time trends can be configured to display the set point (SP), process variable (PV) and
percentage of output (%) of control loops and the process variable of monitor points over a selectable
period of time. The vertical axis determines the range of displayed data while the horizontal axis
determines the history period. The maximum time period that can be shown in a trend is 24 hours.
Figure 2-4 Real-Time Trend
The rate at which the trend plots a new point is based on the time period to be shown. Each buffer
can hold a total of 720 readings for each of the selected channels to plot. The update rate can be
calculated by the formula: time period (in minutes) * 60 / 720. Note that for time periods less than 72
minutes, the update rate will be held to a minimum of 6 seconds. Thus, the update rate will vary from
a minimum of 6 seconds (for time periods of 72 minutes or less) up to a maximum of 120 seconds for
1440 minutes (24 hours).
The
Labels
button cycles through each of the configured plot channels to determine what each
colored plot represents as well as view the current value without having to return to the loop view
screens. The left and right scroll buttons at the upper right of the screen are used to cycle through
each of the eight available charts.
The trends also allow a user to “zoom in” on a particular area to have a more detailed look at current
data. By using a finger to select an area on the screen, the trend will zoom in on that area. To select
a portion of the plot, touch and hold the screen with a finger or stylus. Drag the stylus across the
trend and a box will be drawn around the selected area. Removing the stylus from the screen will
cause the trend to redraw with only the selected plot area. To return to the normal view, touch the ‘X’
or ‘Y’ axis and select zoom out to return to the previous zoom setting or zoom normal to return to the
full display.
Содержание EZT-570S
Страница 1: ...EZT570S User Manual RevC doc 450 V1 2 730 V1 0 EZT 570S Environmental Chamber Controller User Manual ...
Страница 150: ......
Страница 151: ...EZT 570S User Manual A 1 A Appendix ...


