48
CORN I NG ASCENT FBR PD SYSTEM
The steps for creating a new time period are:
1. Toggle off Live Refresh mode to select an absolute time period.
2. In the toolbar, select New Time Period. The Time Bar changes color from blue to red to indicate a new time period creation is active.
• To set an absolute time period:
Click the down arrow beside the first drop down box and select the desired start date and time. Repeat for the end date and time.
Then, select the Refresh button to refresh the Chart.
• To set a relative time period:
Click the arrow next to the third drop down box. Then, select the relative time period.
7.10.2 Tag List Features
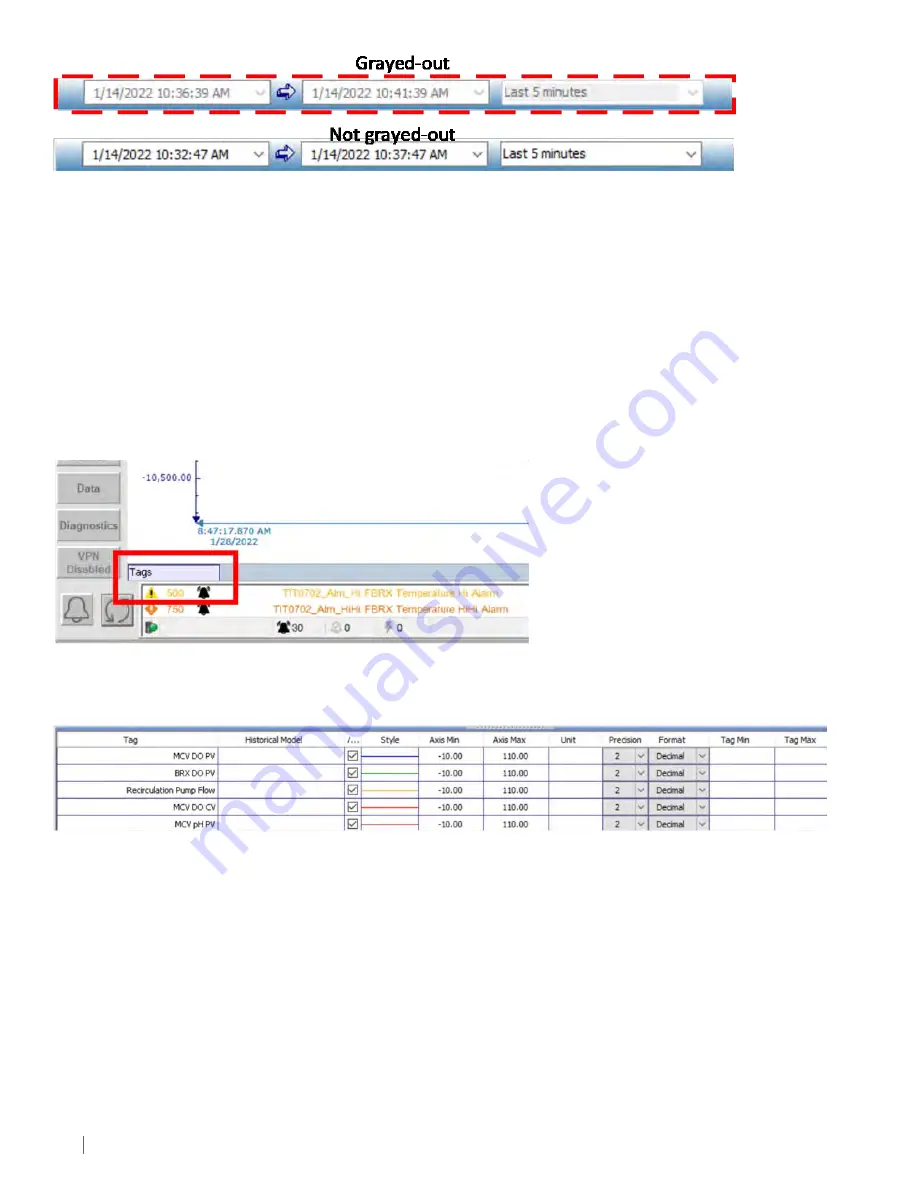
The tag list displays all the current tags or traces that are in the current template. The tag list is normally hidden. To expand the tag
frame, click on the Tags box (Figure 7-38).
Figure 7-37.
Grayed-out versus not-grayed-out time bar.
Figure 7-39.
Tag frame collapsed view.
Figure 7-38.
Click Tags to expand the tag list.
Double click any of the cells in a specific tag row in the tag frame (Figure 7-39) to open the Properties dialog box for each tag. The dialog
box shows tag settings under the traces tab.


