Measure
146
12.7
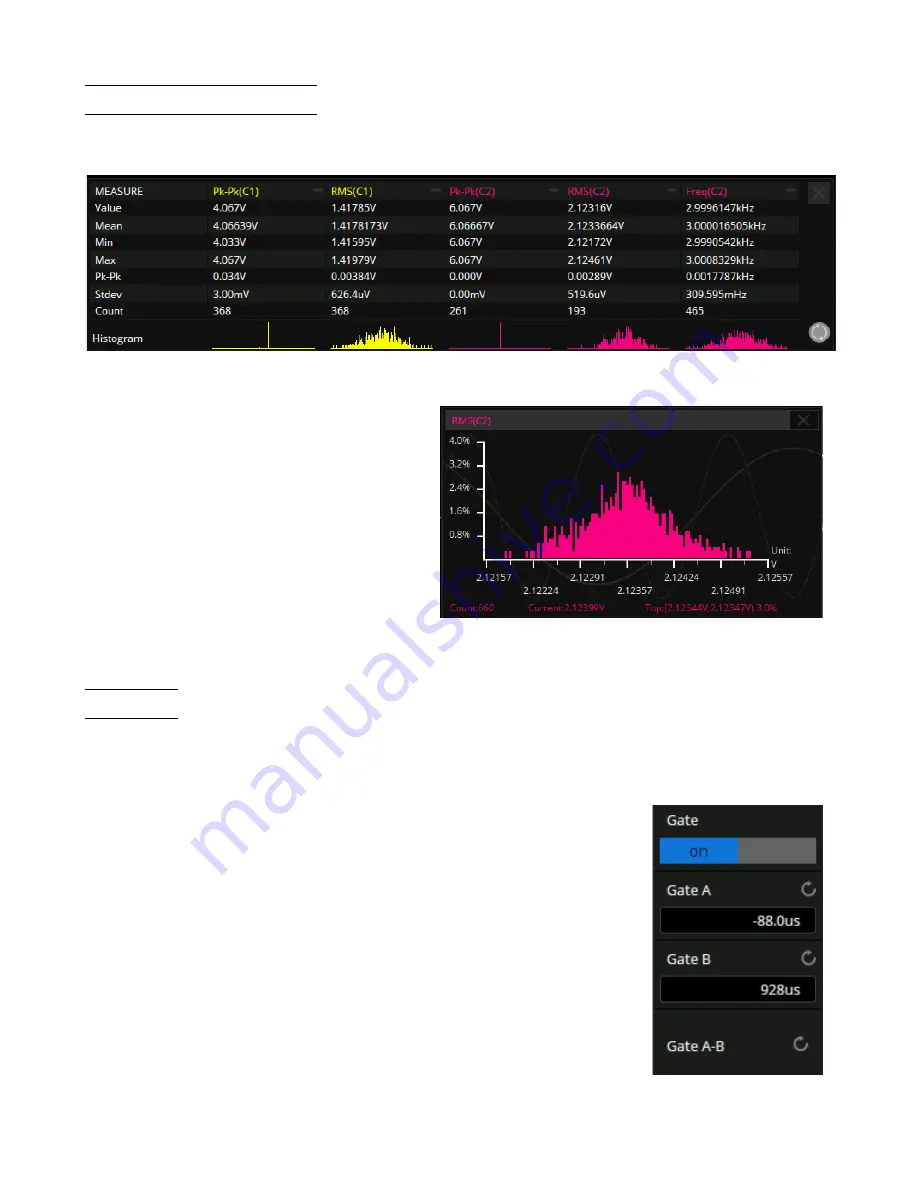
Statistics Histogram
After enabling statistics on a selected measurement, activate a statistical histogram. The histogram appears at the
bottom of the statistics area. This enables users to quickly view the probability distribution of the measured parameters.
Figure 12.17
Histogram Enabled
Touch the histogram area of a parameter to
enlarge it for details. Move the large histogram
window position around the display by dragging.
Touch the histogram of another parameter to
switch to the corresponding enlarged histogram.
Figure 12.18
Histogram Enlarged
12.8
Gate
The
Gate
function is useful to measure parameters for a certain specified time range of the signal and ignore signal parts
that lie outside of that range.
To configure the gate function:
1.
Touch the
Gate
option in the measure config menu to toggle the function on and
off.
–
When enabled the gate settings will appear in the measure config menu. See
figure
2.
Set gate cursors A and B.
–
These cursors define the range of time for parameter measurements. The
oscilloscope will only measure the parameters of the data between A and B.
3.
Touch the
Gate A-B
option and use the
Universal Knob
to move the position of
the gate.
–
The drag gesture can also be used on the touchscreen to move the position of
the gate.
Figure 12.19
Gate Menu
Содержание 2560B Series
Страница 1: ......
Страница 51: ...Digital Channels 51 Figure 8 9 Digital Bus...
Страница 127: ...Serial Trigger and Decode 127 Figure 10 63 Manchester Bus...
Страница 168: ...Reference Waveform 168 Figure 14 1 Recall REFB...
Страница 210: ...Save Recall 210 Figure 22 4 Save As...


