


56
Results
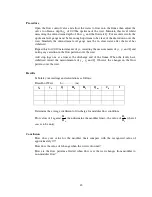
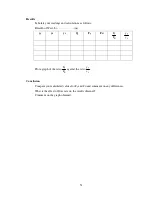
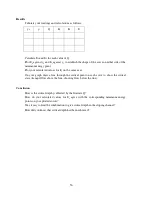
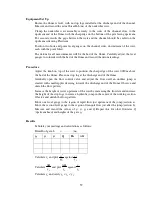
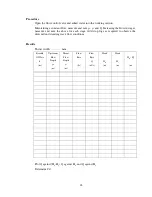
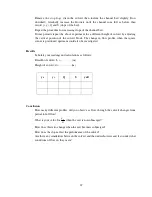
Tabulate your readings and calculations as follows:
y
0
y
1
Q
E
0
E
1
E
Calculate E
0
and E
1
for each value of Q.
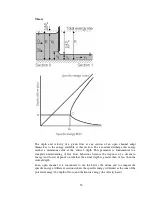
Plot E
0
against y
0
and E
1
against y
1
to establish the shape of the curve on either side of the
minimum energy point.
Plot your calculated values for E
c
on the same axes.
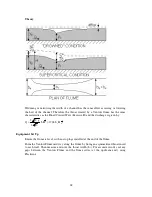
On your graph draw a line through the critical point on each curve to show the critical
state (tranquil flow above the line, shooting flow below the line).
Conclusion
How is the critical depth y
c
affected by the flowrate Q?
How do your calculated values for E
c
agree with the corresponding minimum energy
points on your plotted curves?
Was it easy to find the combination to give critical depth in the sloping channel?
How did you know that critical depth had been achieved?
Содержание C4-MKII
Страница 1: ...An ISO 9001 Company INSTRUCTION MANUAL C4 MKII ISSUE 7 SEPTEMBER 2006 MULTI PURPOSE TEACHING FLUME...
Страница 2: ......
Страница 8: ......
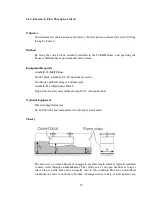
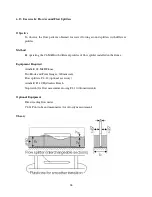
Страница 10: ...8 1 1 Diagram 1 Inlet End of Flume 1 2 3 5 6 8 7 4...
Страница 11: ...9 1 2 Diagram 2 Discharge End of Flume 10 3 1 8 2 7 9 11...
Страница 82: ...80 Phase 2 Deflected nappe Phase 3 Depressed nappe Phase 4 Air Partialised...


