


39
Results
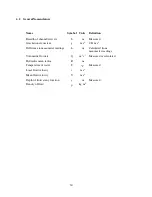
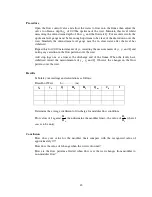
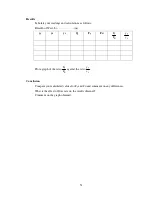
Tabulate your readings and calculations as follows:
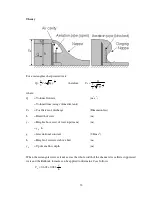
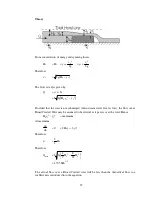
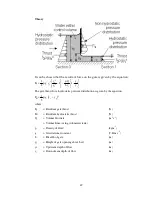
Breadth of Weir
b
=…………(m)
Height of weir
h
w
=…………(m)
y
0
y
1
Q
actual
H
0
Q
theoretical
C
d
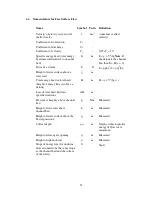
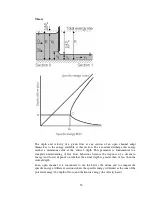
Plot graphs of Q
actual
against H
0
and C
d
against H
0
.
Conclusion
Does the magnitude of the flowrate affect the discharge coefficient C
d
? Does C
d
increase
or decrease with increasing flowrate?
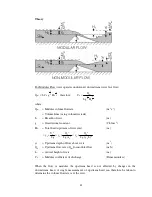
What is the pattern of the water as it passes over the weir?
Does the height of the weir affect the discharge coefficient?
Would you expect the length of the weir crest to affect the discharge coefficient C
d
?
What is the effect of drowning the weir (increasing the downstream depth)? How does
drowning affect the accuracy of the results?
Содержание C4-MKII
Страница 1: ...An ISO 9001 Company INSTRUCTION MANUAL C4 MKII ISSUE 7 SEPTEMBER 2006 MULTI PURPOSE TEACHING FLUME...
Страница 2: ......
Страница 8: ......
Страница 10: ...8 1 1 Diagram 1 Inlet End of Flume 1 2 3 5 6 8 7 4...
Страница 11: ...9 1 2 Diagram 2 Discharge End of Flume 10 3 1 8 2 7 9 11...
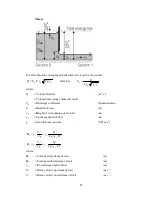
Страница 82: ...80 Phase 2 Deflected nappe Phase 3 Depressed nappe Phase 4 Air Partialised...


