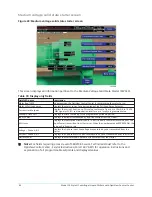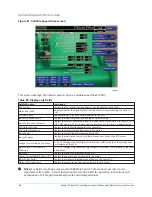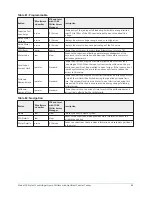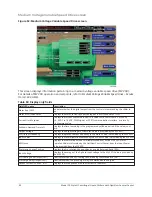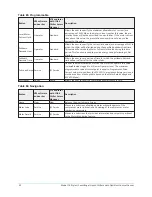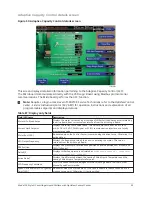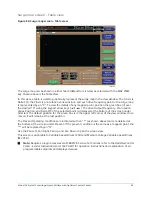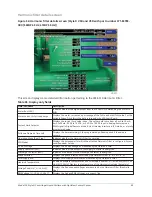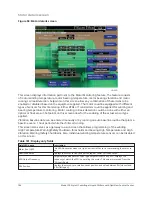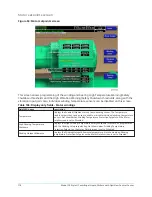
Surge map screen - Table view
Figure 54: Surge map screen - Table view
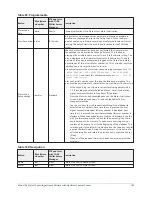
The surge map can be shown in either Table (default) or List view as selected with the MAP VIEW
key. Shown above is the Table View.
In this view, a table is used to graphically represent the surge map in the view window. The X-Axis is
Delta P/P, the Y-Axis is pre-rotation vanes position and each drive frequency point in the surge map
is represented by an “X”. To view the details of any mapped point, position the green box (□) over
the desired “X” using the keypad arrow keys (▲▼◄►). The drive Output Frequency, Pre-rotation
Vanes Position, and Delta P/P of the selected point is displayed at the bottom of the screen under
Selected. The default position for the green box is in the upper left corner of the view window. Once
moved, it will remain at the last position.
The Present Operating conditions are indicated with an “*” (as shown above) and are detailed at
the bottom of the screen under Present. If the present condition is the same as a mapped point, the
“*” will be replaced by an “O”.
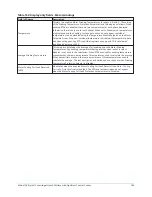
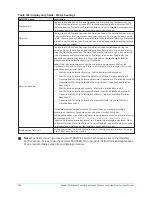
Use the Pan Left, Pan Right, Pan Up and Pan Down to pan the screen view.
This screen is applicable to Variable Speed Drives (VSD) and Medium Voltage Variable Speed Drives
(MV VSD).
Note:
Requires a login access level of SERVICE. Service Technicians refer to the
OptiView Control
Center - Service Instructions (Form 160.76-M1)
for operation instructions and explanation of all
programmable setpoints and displayed values.
95
Model YK Style H Centrifugal Liquid Chillers with OptiView Control Center

