If a power failure occurs while the trending is running, the trending is stopped. Upon restoration
of power, the last screen of data that was collected will be displayed on the Trend Screen. The Start
key must be pressed to initiate a new Trend Screen.
Display only
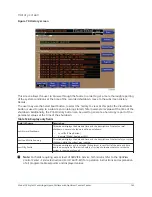
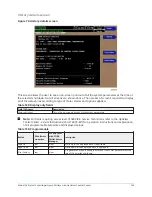
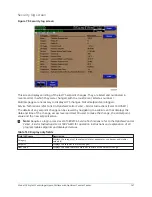
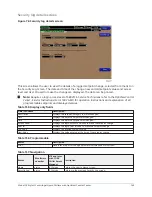
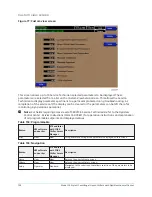
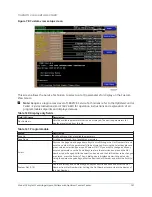
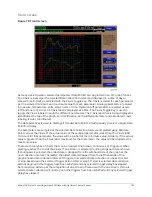
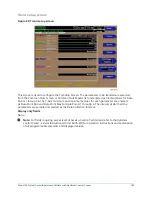
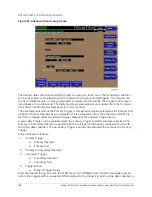
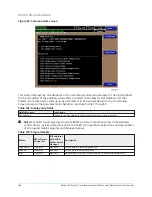
This screen allows the user to view the graphical trending of the selected parameters and is also a
gateway to the graph setup screens.
Note:
•
A red screen with the words
TREND MAX MUST BE > TREND MIN
appears if the Y-axis
minimum has been programmed to a value that is greater than the Y-Axis maximum for
any parameter. If this appears, proceed to the Trend Setup Screen to change the values.
•
For fields requiring access level of Service. Service Technicians refer to the
OptiView
Control Center - Service Instructions (Form 160.76-M1)
for operation instructions and
explanation of all programmable setpoints and displayed values.
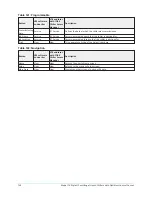
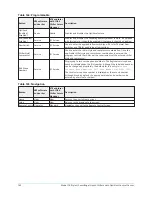
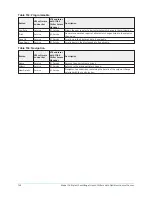
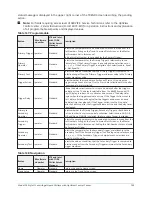
Table 163: Programmable
Button
V09 software
and earlier
V10 and later
with YORK
Chiller Access
Manager
Description
Start
Operator
Standard
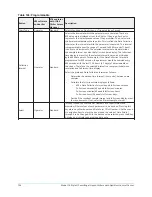
Pressing this key clears the graph, starts a new graph, sets the time of
day to the present clock time and begins the trending. This key is only
available if trending is stopped. If the selected Chart Type is triggered
and Trigger Action is set to Start, data collection will not begin until the
triggers have been satisfied and any selected trigger delay has elapsed.
Otherwise, data collection will begin immediately.
Stop
Operator
Standard
Pressing this key stops the trending. The trend data is frozen on the
display until another graph is started with the Start key. The Stop key is
only available if trending is running.
View
View
Allows the data on the Trend Screen to be printed in tabular format. If
set to existing, a snapshot of the data presently on the screen is sent to
the printer. If set to new, all data collected after pressing this key will be
sent to the printer as it is collected. If set to disabled, no data is sent to
the printer. See
for example.
Data Select
View
View
Allows the user to display all trended data points simultaneously or select
a single trended data point for display, hiding the other data points.
Selections are All Data or Data Point X (1-6).
Y-Axis
View
View
This key toggles the Y-Axis labels of the graph. Each key press changes the
label to another of the selected parameters.
X-Axis
View
View
This key toggles the X-Axis labels of the graph. Each key press alternates
the scaling between time of day and elapsed time. Time of Day scaling
is in 24- hour format. Elapsed Time scaling is the time elapsed since the
Start key was pressed, starting the trending.
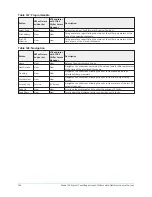
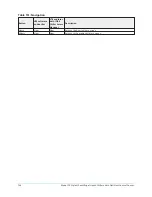
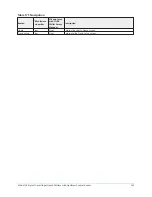
Table 164: Navigation
Button
V09 software
and earlier
V10 and later
with YORK
Chiller Access
Manager
Description
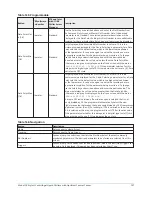
Home
View
View
Returns the user to Home screen.
History
View
View
Returns the user to History screen.
Trend Setup
View
View
Only displayed if the trending is stopped. Navigates to a subscreen for
configuring the trending display.
Model YK Style H Centrifugal Liquid Chillers with OptiView Control Center
154

