35
3
SCREENS AND OPERATIONS
35
SCREENS AND OPERATIONS
Chapter
3
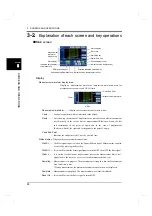
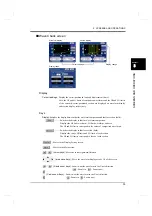
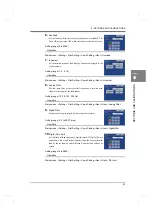
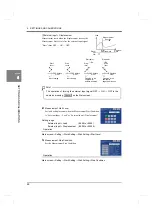
Load/displacement HI and LO limits:
The HI and LO limits of each section are indicated
by red lines.
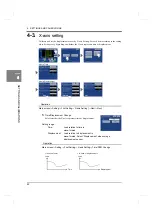
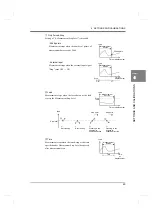
The measurement waveform display area on the Main screen is as follows:
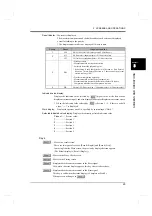
- About the display range
For example, this function is convenient for changing the display range with an observation of the
details of the waveform.
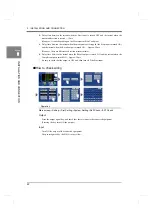
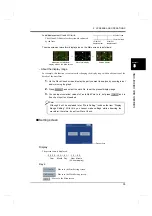
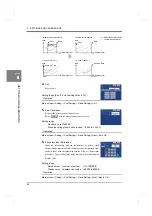
1.
On the Wave Check screen, display the part you want to analyze by zooming in/out
and/or moving the graph.
2.
Press
, and select the work No. to set the present display range.
3.
You can input numerical values to Y-axis Start Point, etc., but press
as it is
if such an input is not needed.
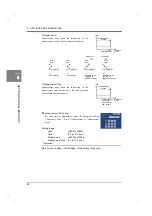
■
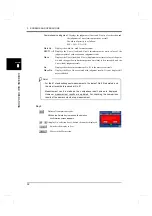
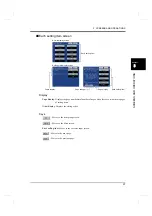
Setting screen
Display
The present time is displayed.
Keys
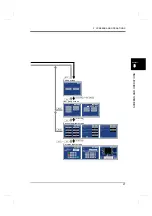
: Moves to the First Setting screen.
: Moves to the Work Setting screen.
: Moves to the Main screen.
LO limit of
HI limit of
HI limit of load
LO limit of load
displacement
displacement
Measurement waveform
Waveform display
Section display
display area on the Main screen
=
+
Although it will be explained later, “Work Setting” includes the item “Display
Range Setting.” With this, you cannot make settings while observing the
waveform; therefore, do so from Wave Check.
Point
Present time
Year
2 0 0 6 / 0 2 / 0 1 /
1 9 : 0 5
Month Day
Hour Minute
(24-hour display)
Summary of Contents for DeviceNet F381A
Page 1: ...15APR2013REV 3 10 DYNAMIC FORCE PROCESSOR F381A OPERATION MANUAL ...
Page 9: ...Contents VIII Contents VIII M E M O ...
Page 34: ...25 2 INSTALLATION AND CONNECTION 25 INSTALLATION AND CONNECTION Chapter 2 M E M O ...
Page 147: ...138 8 SPECIFICATIONS 138 SPECIFICATIONS Chapter 8 8 2 Outside dimensions Unit mm ...
Page 164: ......


