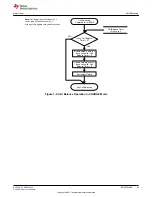
Upon Entering
RELAX Mode
Voltage()
Is
dV/dt of
Voltage()
<
4
µ
V/s
No
Has Internal Timer
exceeded 5 hrs?
Clear and Start Internal Timer
No
Yes
Yes
Exit of Power
On Reset
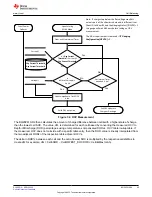
Note: If charge stop below the flat voltage max (this
value is part of the chemistry data and is different from
ChemID to ChemID), and the
GaugingStatus()[OCVFR]
= 1,
the gauge will wait 48 hours before taking an OCV
measurement.
The 48-hr requirement is removed if
IT Gauging
Configuration [OCVFR ]
= 0.
Update Impedance Track OCV
data
Valid OCV is acquired.
Is (–
Dsg Current
Threshold
) >
Current ()
>
Chg Current Threshold
No
Yes
Exit OCV Update to
Charge or Discharge
Current ()
Chg Current Threshold
Dsg Current Threshold
Figure 7-2. OCV Measurement
The BQ28Z610-R2 then calculates the amount of charge difference between cells with a higher state-of-charge
than the lowest cell SOC. The value, dQ, is determined for each cell based by converting the measured OCV to
Depth-of-Discharge (DOD) percentages using a temperature-compensated DOD vs. OCV table lookup table. If
the measured, OCV does not coincide with a specific table entry, then the DOD value is linearly interpolated from
the two adjacent DODs of the respective table adjacent OCVs.
The delta in DOD% between each cell and the cell of lowest SOC is multiplied by the respective cells QMax to
create dQ: for example, dQ = CellnDOD – CellLOWEST_SOC DOD × CellnQMax (mAh).
Cell Balancing
SLUUCO0 – APRIL 2022
BQ28Z610-R2
45
Copyright © 2022 Texas Instruments Incorporated


