R&S FSH
Two-port measurements with the tracking generator
1145.5973.12 4.107
E-14
Displaying the reflection in the Smith chart
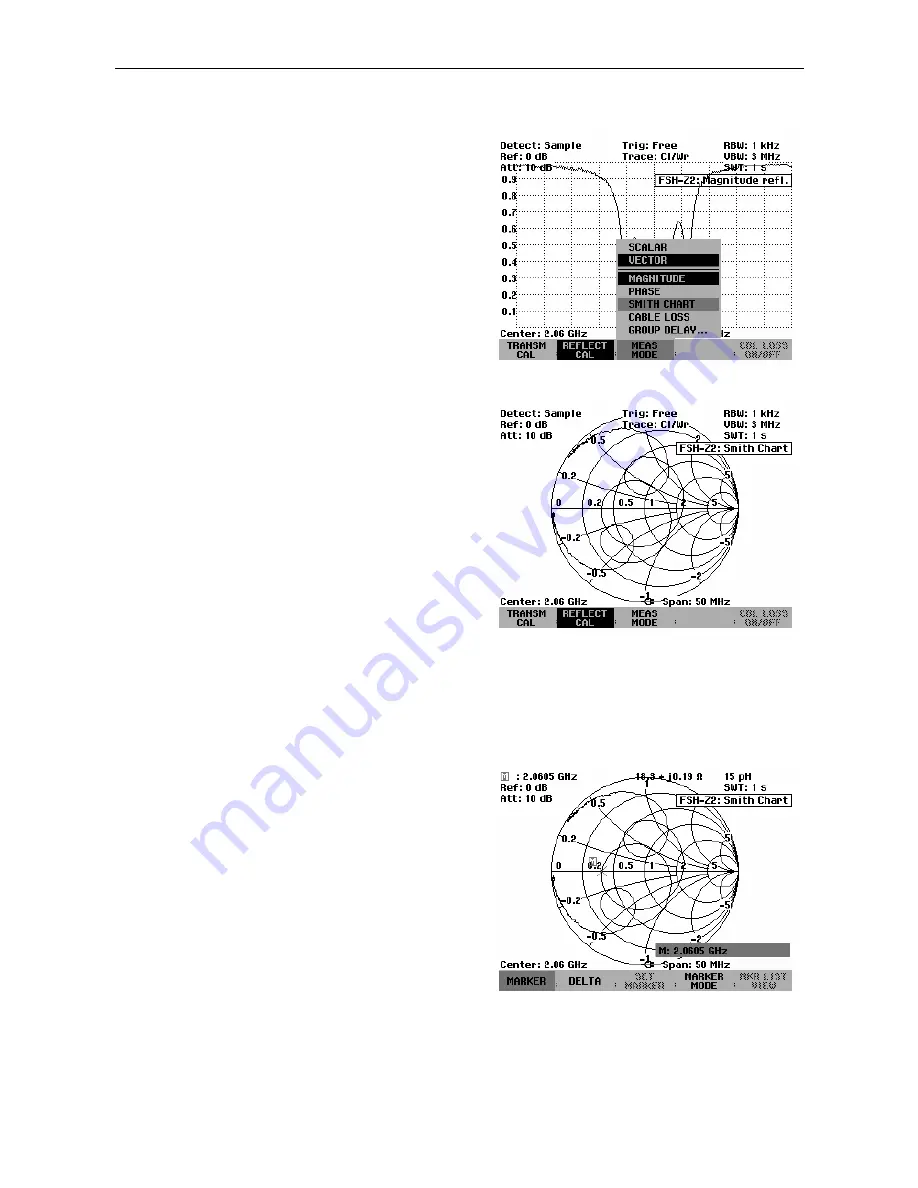
Press the MEAS MODE softkey.
Using the cursor keys or the rotary knob, select
SMITH CHART from the menu.
Confirm the selection with the ENTER key or by
pressing the MEAS MODE softkey again.
The R&S FSH will show the reflection of the DUT in
the Smith chart.
Using the markers in the Smith chart:
Like with the scalar measurement, the Smith chart display also provides all marker functions (marker,
delta marker, multi-marker (see also section "Using the Markers"). The Smith chart also provides
additional marker formats for vector reflection measurements.
Press the MARKER key. The R&S FSH will activate
the marker menu and a marker.
You can shift the marker on the complex reflection
curve by using the rotary knob or the cursor keys,
or by entering numeric values.
The marker values will first be output in numeric format
with the marker frequency and the complex resistance
((real component) + j (imaginary component)) in
[
. If
you need to display the complex reflection factor, for
example, you can modify the marker format
accordingly.
深圳市盛腾仪器仪表有限公司
Tel:0755-83589391
Fax:0755-83539691
Website: www.Sengt.com


