Getting Started
R&S
®
FSPN
73
User Manual 1179.4363.02 ─ 01
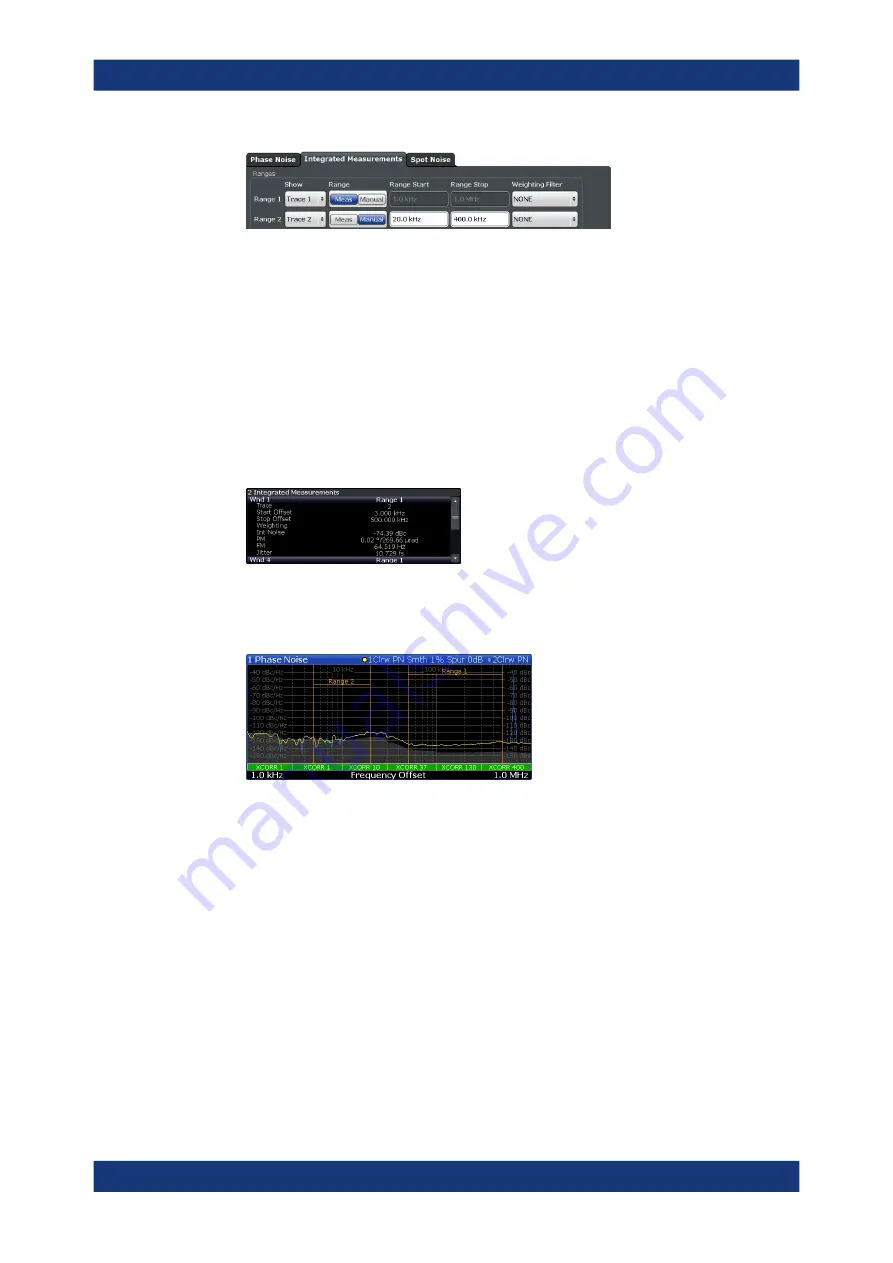
3. Select the "Trace" whose data you would like to integrate from the "Show "drop-
down menu.
Tip:
If you select a trace that is currently not displayed in the diagram, no integra-
ted measurement results will be displayed for the corresponding range.
4. Select "Manual" integration ranges.
5. Define the frequency ranges ("Range Start" and "Range Stop") over which you
would like to integrate.
The application calculates the measurement results as defined. Result in the inte-
grated measurements result table are adjusted accordingly (see
on page 68 for a description on how to view that table).
Figure 3-6: Custom integration range results (frequency range from 3 kHz to 500 kHz, applied to
trace 2)
Note that the integration ranges are displayed graphically in the noise diagram.
Figure 3-7: Custom integration ranges are represented in the diagram as colored lines
How to correct integrated measurements
You can use so called weighting filters to compensate external effects that affect the
phase noise in certain frequency ranges.
Weighting filters are applied before trace are smoothed and before integration is
applied.
1. Enter the "Overview" dialog box, and from there, enter the "Noise Config" dialog
box.
2. Select the "Integrated Measurements" tab.
3. Select a weighting filter from the corresponding dropdown menu.
Trying Out the Instrument


