Debugging voice data
551
SmartWare Software Configuration Guide
42 • VoIP debugging
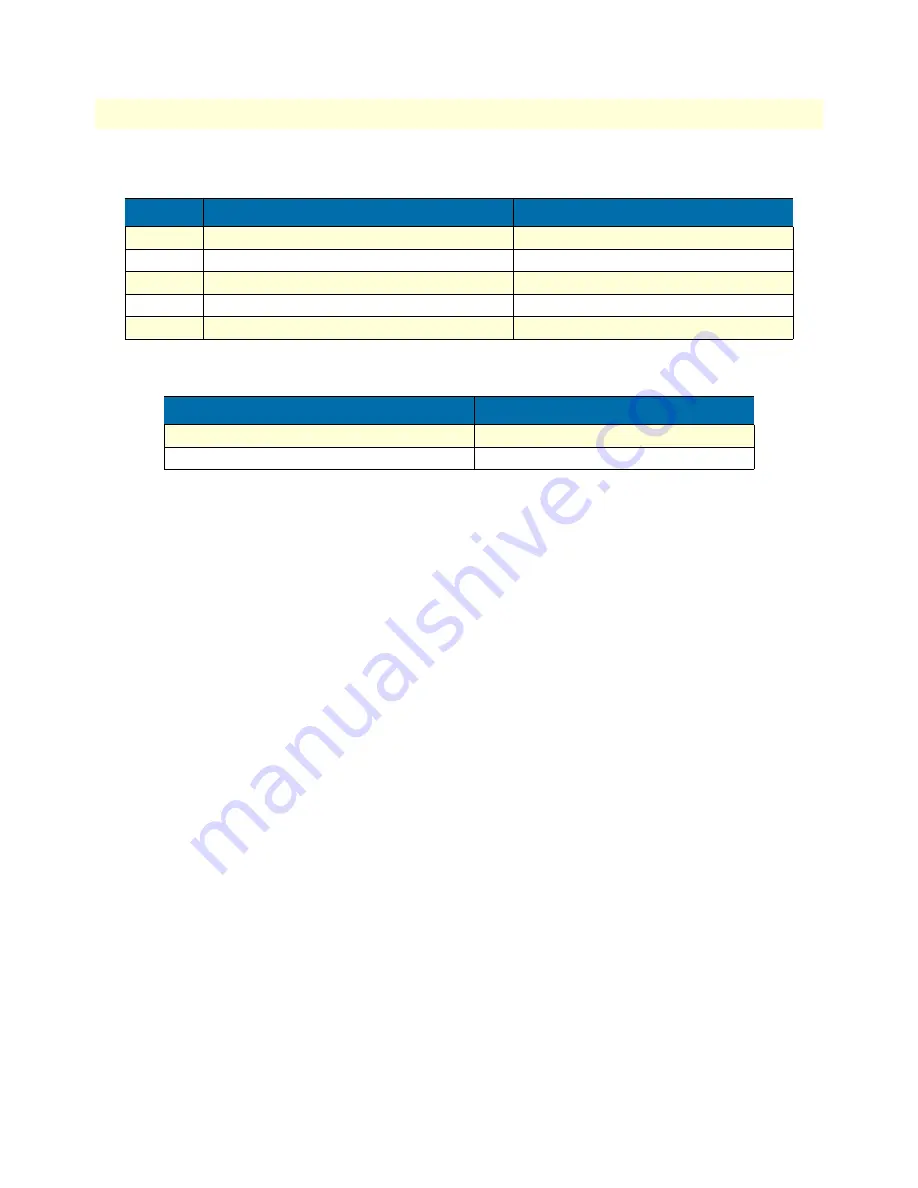
Use the following debug monitors to start with, if you assume that signaling is OK:
Depending on the type of problem, use also:
Check system logs
See section
“Displaying the system logs”
on page 90.
How to submit trouble reports to Patton
Due the wealth of functionality and complexity of the products there remains a certain number of problems,
either pertaining to the Patton product or the interoperability with other vendor's products.
If you have a problem for which you need supplier help please prepare and send the following information:
•
Problem description
—Add a description of the problem, if possible together with applicable augmented
information with a diagram of the network setup (with Microsoft tools).
•
Running configuration and software and hardware version information
—With the Command Line Inter-
face commands
show running-config
and
show version
you can display the currently active configura-
tion of the system (in a Telnet and/or console session). Adding to the submitted trouble report will help us
analyze the configuration and preclude possible configuration problems.
In the unlikely case of a suspected hardware problem also submit the serial number of your unit(s) and/or
interface cards.
•
Event logs
—Add the system event logs, which you can display with the Command Line Interface com-
mands
show log
and
show log supervisor
. To ensure that the logs are useful, it is necessary to set upon
start up the clock to actual date and time (by hand or by enabling SNTP client)
•
Your location
—For further enquiries please add your E-mail address and phone number.
If possible, add the following information in addition to the above:
•
Logs of protocol monitors
—Protocol traces contain a wealth of additional information which may be very
helpful in finding or at least pinpointing the problem. Various protocol monitors with different levels of
detail are an integral part of the firmware and can be started (in a Telnet and/or console session) individually
(
debug
command).
Step
Command
Purpose
1
unit#debug voip events
Enable the voip events monitor.
2
unit#debug voip t38 events
Enable the T.38 events monitor
3
unit#debug voip t38 dejitter
Enable the T.38 dejitter monitor
4
unit#debug dsp error
Enable the DSP error monitor.
5
unit#debug dsp t30
Enable the T.30 flow monitor
Command
Purpose
unit#debug dsp events
Enable the DSP event monitor
unit#debug dsp ifp
Enable the IFP decoding monitor


