JuLI™ Stage STAT Software
100
JuLI
TM
Stage - User Manual
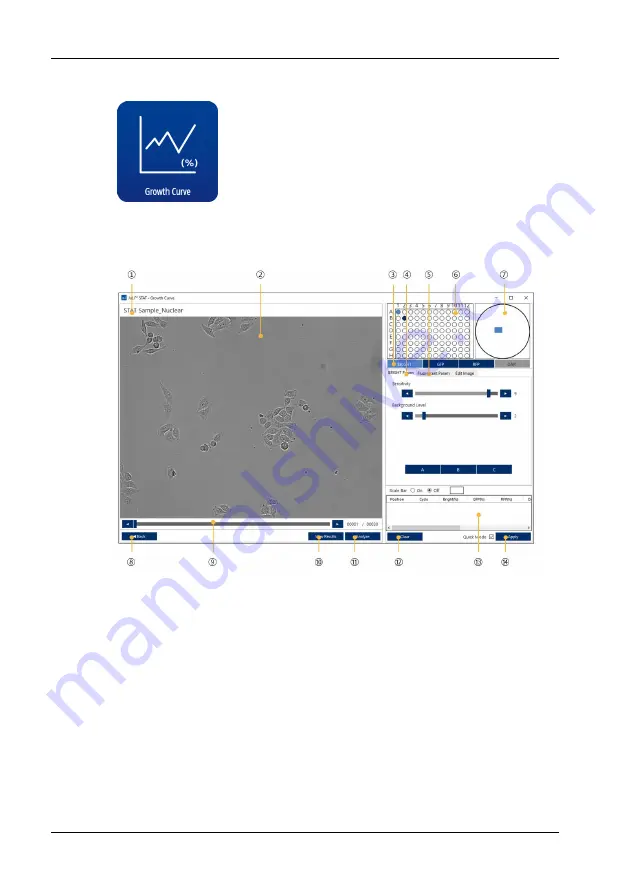
12.2.2.1 Growth Curve
The
Growth Curve
analysis is used to quantify the cell confluence in images over
time, based on both brightfield or fluorescence images. In addition, the mean
fluorescence intensity per well is calculated for fluorescence channels automatically.
①
Project / measurement name
②
Image view
③
Channel selection
④
Brightfield channel param.
⑤
Fluorescence channel param.
⑥
Vessel display
⑦
Well navigation
⑧
Back (to main viewer)
⑨
Time lapse slider
⑩
View results
⑪
Analyze
⑫
Clear results list
⑬
Confluence result list
⑭
Apply
Summary of Contents for JuLi Stage
Page 1: ......


