Page 70
Data Processing
thermoIMAGER TIM Connect
Any measure area can be renamed individually in the
Name
field. Under the field
Shape
the
different measuring shapes can be selected. The table above shows the available shapes.
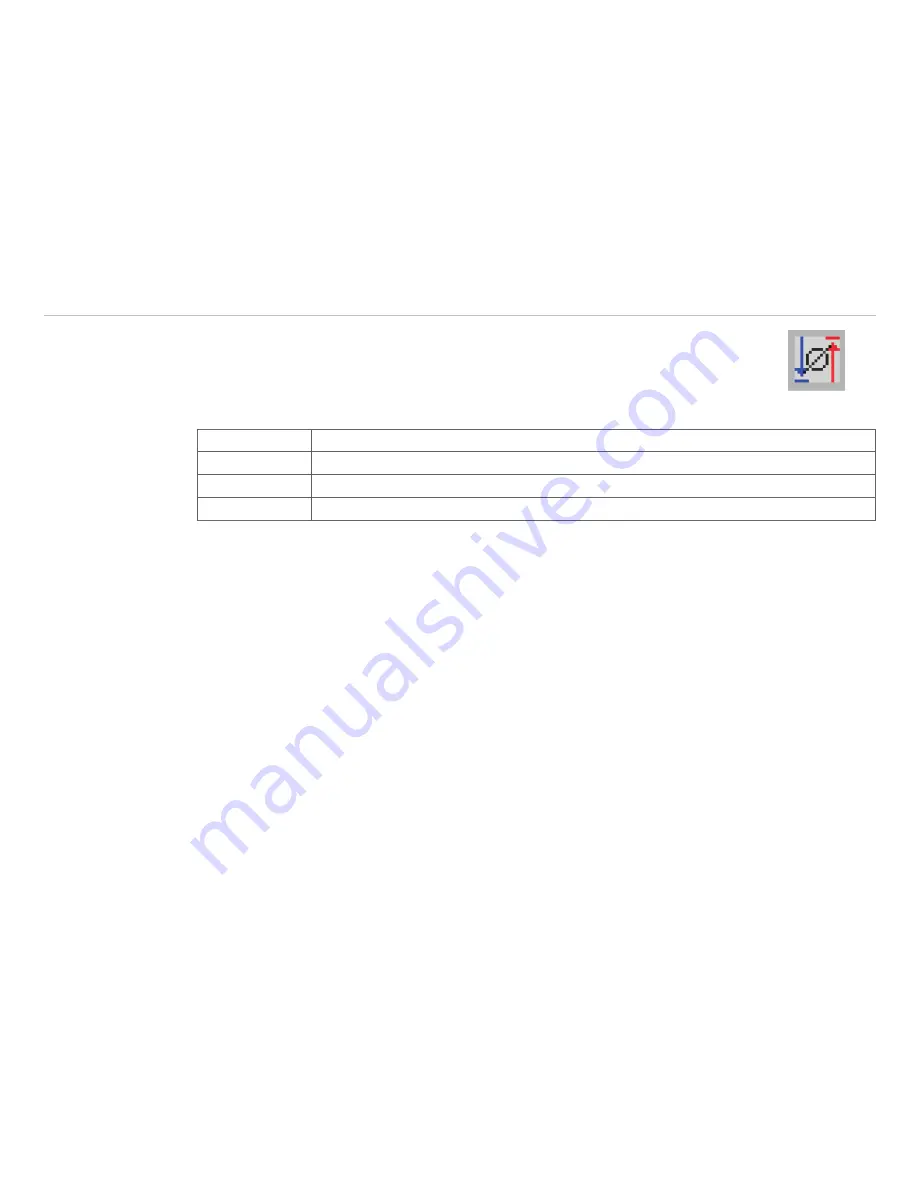
The temperature of the main measuring area can also be displayed in the main window. The
value, which is displayed, is defined over the
Minimum, Maximum, Mean value
or
Dis-
tribution [%]
in the field
Mode
or via the icon in the toolbar.
Minimum
Min. value is shown.
Maximum
Max. value is shown.
Mean value
Mean value is shown.
Distribution [%]
Indicates the percentage distribution between two selected temperatures.
In the
Position
section the exact
Location
and
Size
of the measure area within the main window can be
defined. The moving and minimizing or maximizing of the measuring fields can also be realized directly at the
measuring field in the main window. By moving the cursor to the edges of the measuring field, the grippers
can be used to adjust the size of thermal image or to move the image completely (hold
Ctrl
synchronously).
If desired the area can represent a
Hot spot
(spot or area with highest mean temperature in the image) or
a
Cold spot
(spot or area with lowest mean temperature in the image).
Using
Center
you will be moving the measure area into the middle of the main window, using
Standard
size
the rectangle will be set in a predefined size. Under
Label in image
, you can select whether the
Name
,
Mode
and / or
Value
is to be displayed in the image.
Two-lines
means that the selected labels are
displayed one after the other.
Using
Bind to temperature profile
you can assign each measure area to one of the two temperature
profile (
Profile 1
/
Profile 2
).
The position of the measure area and the profile can be determined by the option
Location [%]
. The size
ratio can be defined by the option
Min. Size
.


