Description of the “Evaluation” View
Page 105
The measuring program outputs the following measured values:
-
Line angle to x/y plane: The angle of the edge with respect to the X/Y plane.
-
Line angle to y/z plane: The angle of the edge with respect to the Y/Z plane.
-
Line angle to z/x plane: The angle of the edge with respect to the Z/X plane.
-
Center x: The X coordinate of the center point of the points which has been used to calculate the
edge.
-
Center y: The Y coordinate of the center point of the points which has been used to calculate the
edge.
-
Center z: The Z coordinate of the center point of the points which has been used to calculate the
edge.
-
Number of points: The number points that were used to calculate the edge.
-
Sigma: The standard deviation of the distances between the points that were used to calculate the
edge and the calculated edge.
-
Peak to Valley (PV):
The distance between the two points that are furthest away inwards and out-
wards from the edge, relative to the computed edge. The two points are determined from the
points that were used to calculate the edge.
Note: The edge points are projected onto the reference plane and the projected points are used for com-
puting the edge and the distances for sigma and PV.
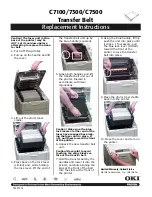
Fig. 6.11: “Edge” Measuring Program
Display Elements and Parameters in the “Edge” Program:
A
“General” toolbar: Using this toolbar, you can select the data source (see Chapter
save and load parameters and reset selected parameters to default settings (see Chapter
).
B
List of active measuring programs: This section displays the active measuring programs from
the “Find objects” and “Combine objects” groups. You can add and remove measuring pro-
grams/measuring program groups (see Chap.
), move measuring programs (see
) and select an active measuring program for parameterizing and displaying the
measured values.
C
Measuring program groups / Tab bar for switching between views: This tab bar allows you
to switch between the four main views (see Chap.
). To the left of the tab bar you find the sec-
tion for adding, removing and selecting measuring program groups (see Chap.
D
3D-View: The 3D-View visualizes the 3D data (see Chap.
A
B
C
I
G
E
D
F
H
1
3
2
Summary of Contents for reflectCONTROL RCS
Page 1: ...3DInspect 1 1 Instruction Manual ...
Page 25: ...Working with 3DInspect Page 25 ...
Page 72: ...Description of the Data Preprocessing View Page 72 ...
Page 74: ...Description of the Data Preprocessing View Page 74 ...
Page 129: ...Appendix Page 129 ...
Page 133: ......