Description of the “Data Preprocessing” View
Page 77
5.1.10
“High Pass Filter” Measuring Program
Use the “High Pass Filter” program in order to compute the difference of a point cloud which has been
filtered with a low pass filter from the original point cloud. Structures with a wavelength smaller than the
predefined cut-off wavelength are preserved and components with greater wavelengths are removed
from the data. This makes it possible to bring out structures of point clouds. The size of the filter kernel is
determined with the standard deviation calculated from the entered wavelength and the selected mode
and is displayed in the “Kernel size” info box. The mode makes it possible to strike a balance between
high execution speed and optimal filter behavior. The algorithm parameter can be used to select the di-
rection in which the filter acts. The behavior at the border of the point cloud can be adjusted with the
“Border mode” parameter. Proceed as follows:
-
If applicable, select the input data for the high pass filter (see below, section “1” and Chap.
-
Select the algorithm, the cut-off wavelength, the mode and the border mode (see below, section
“2”):
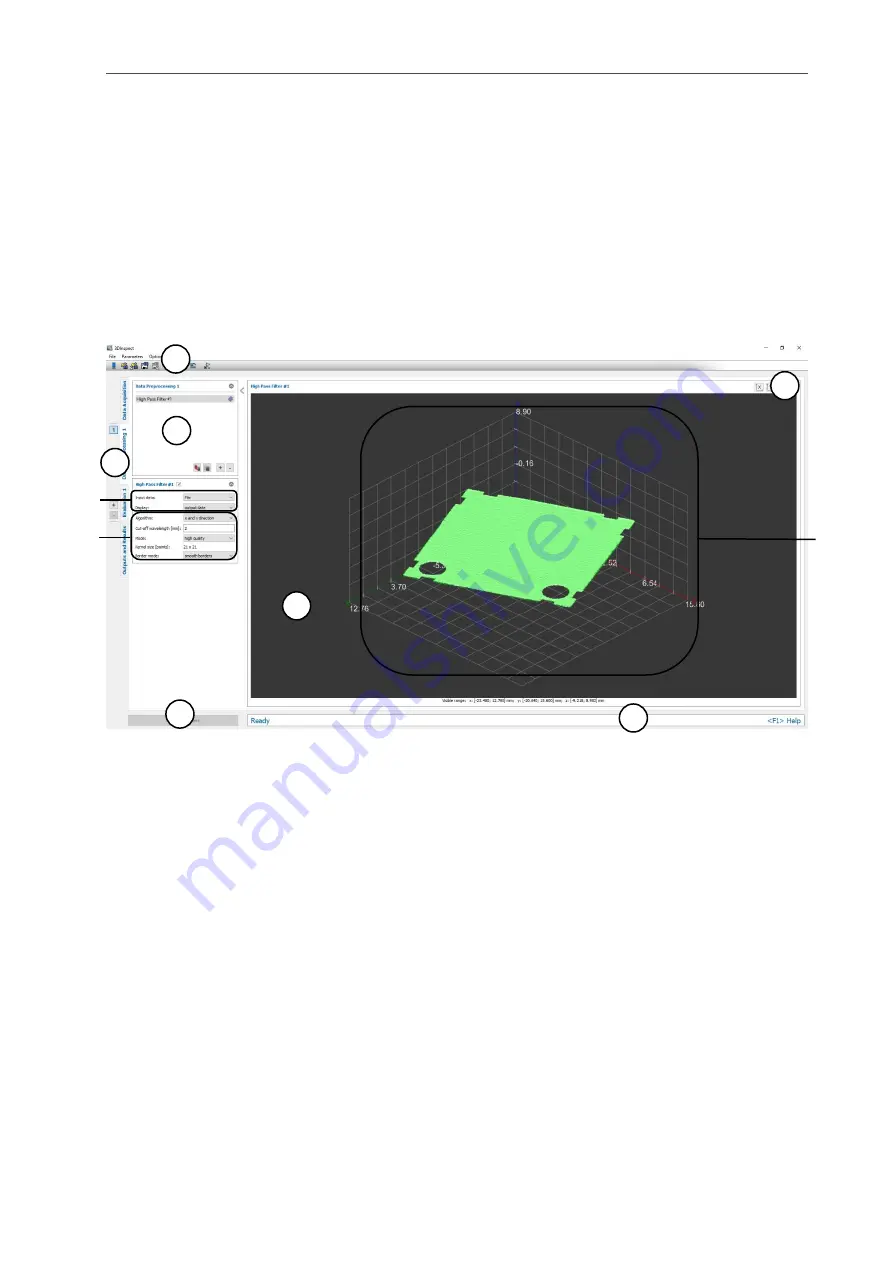
Fig. 5.13: “High Pass Filter” Measuring Program
Display Elements and Parameters in the “High Pass Filter” Program:
A
“General” toolbar: Using this toolbar, you can select the data source (see Chapter
save and load parameters and reset selected parameters to default settings (see Chapter
).
B
List of active measuring programs: This section displays the active measuring programs from the
“Data preprocessing” group. You can add and remove measuring programs (see Chap.
) and select an active measuring program for parameterizing and dis-
playing the measured values.
C
Measuring program groups / Tab bar for switching between views: This tab bar allows you to
switch between the four main views (see Chap.
). To the left of the tab bar you find the section
for adding, removing and selecting measuring program groups (see Chap.
D
3D-View: The 3D-View visualizes the 3D data (see Chap.
E
3D-View toolbar: Use this toolbar to configure the orientation of the coordinate system in the 3D-
View (see Chap.
F
“Start measurement” button: Click on this button to perform a measuring operation, calculate the
measurement results and display the point cloud and measurement results of the currently se-
lected measuring program in the 3D-View.
G
Status bar: Status and error messages are displayed in the status bar (see Chapter
A
B
C
F
D
E
1
3
2
G
Summary of Contents for reflectCONTROL RCS
Page 1: ...3DInspect 1 1 Instruction Manual ...
Page 25: ...Working with 3DInspect Page 25 ...
Page 72: ...Description of the Data Preprocessing View Page 72 ...
Page 74: ...Description of the Data Preprocessing View Page 74 ...
Page 129: ...Appendix Page 129 ...
Page 133: ......


