18
Section 3: AccuLase-GPA™ Local Display User Interface
3.1 Introduction
The front panel of the AccuLase-GPA™ control enclosure includes three LEDs and a color LCD display which
provides information about the status of the analyzer. In addition, a handheld keypad can be used to view
and/or edit a range of analyzer settings and analytical results.
3.2 Local UI Layout
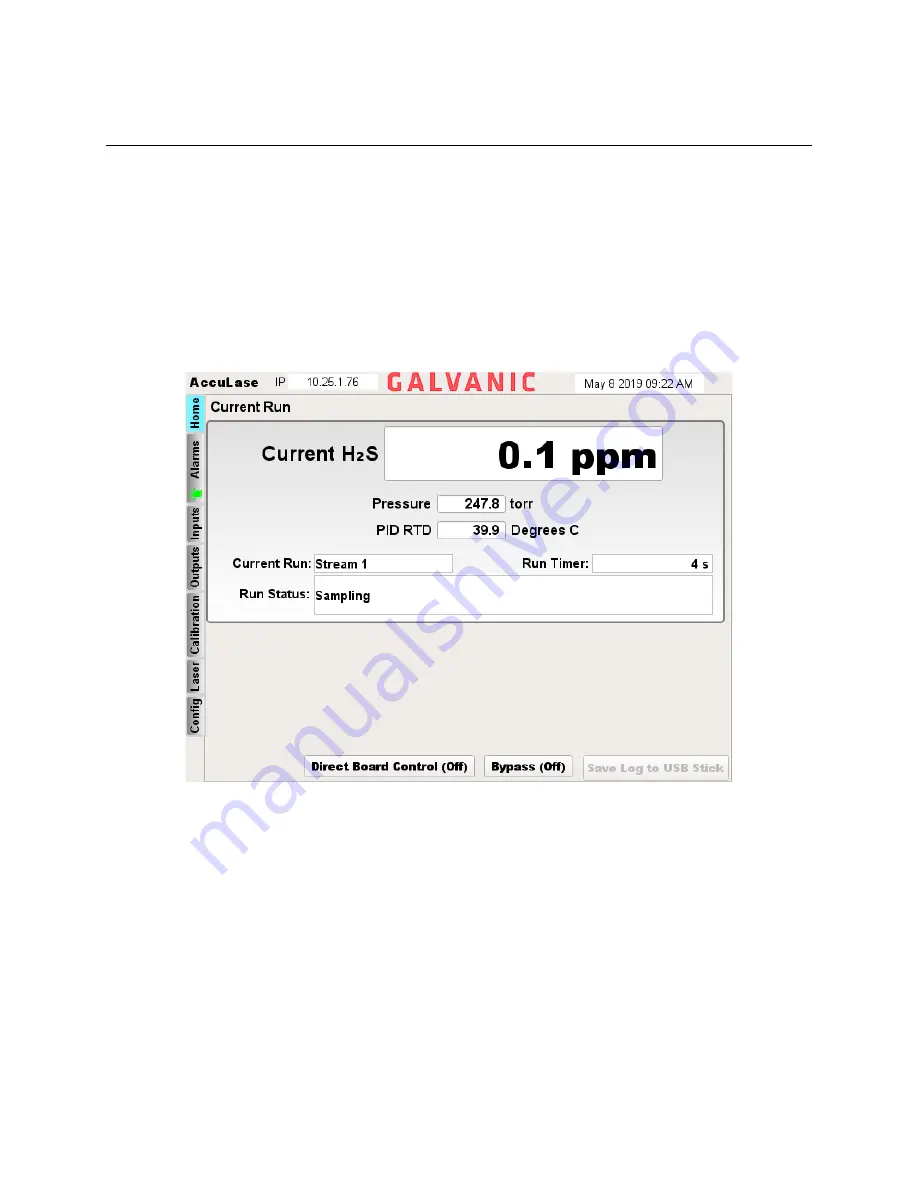
The screen layout of the AccuLase-GPA™ local UI is shown in Figure 14.
Figure 6: Local UI Layout
On the top row of the screen are two fields. The field on the left displays the analyzer’s IP address. This is
the address that must be entered into the web browser of a computer connected either directly to the
analyzer via the Ethernet port on the front panel of the analyzer or remotely via the plant local area
network in order to access the analyzer’s web-based graphical user interface. The Web GUI is described
in detail in Section 4. The field on the right displays the current date and time of the analyzer’s real time
clock. This date and time is used to timestamp all data in the analyzer’s data logs.
On the left of the screen are a series of tabs oriented vertically. These tabs represent the various panels
of the analyzer’s local user interface. The tab of the panel that is currently being displayed on the screen
is highlighted in blue. The PANEL NEXT and PANEL PREV buttons on the keypad can be used to navigate
through these panels. Pressing PANEL NEXT will move downwards to the subsequent tab, while pressing
PANEL PREV will move up to the previous tab. Pressing PANEL NEXT from the bottom-most tab will return
to the top-most tab. The data displayed on each panel will be discussed in detail in this section.


