Revision 4
39
12/15/2018
4.5.1.1 Ribbon Bar
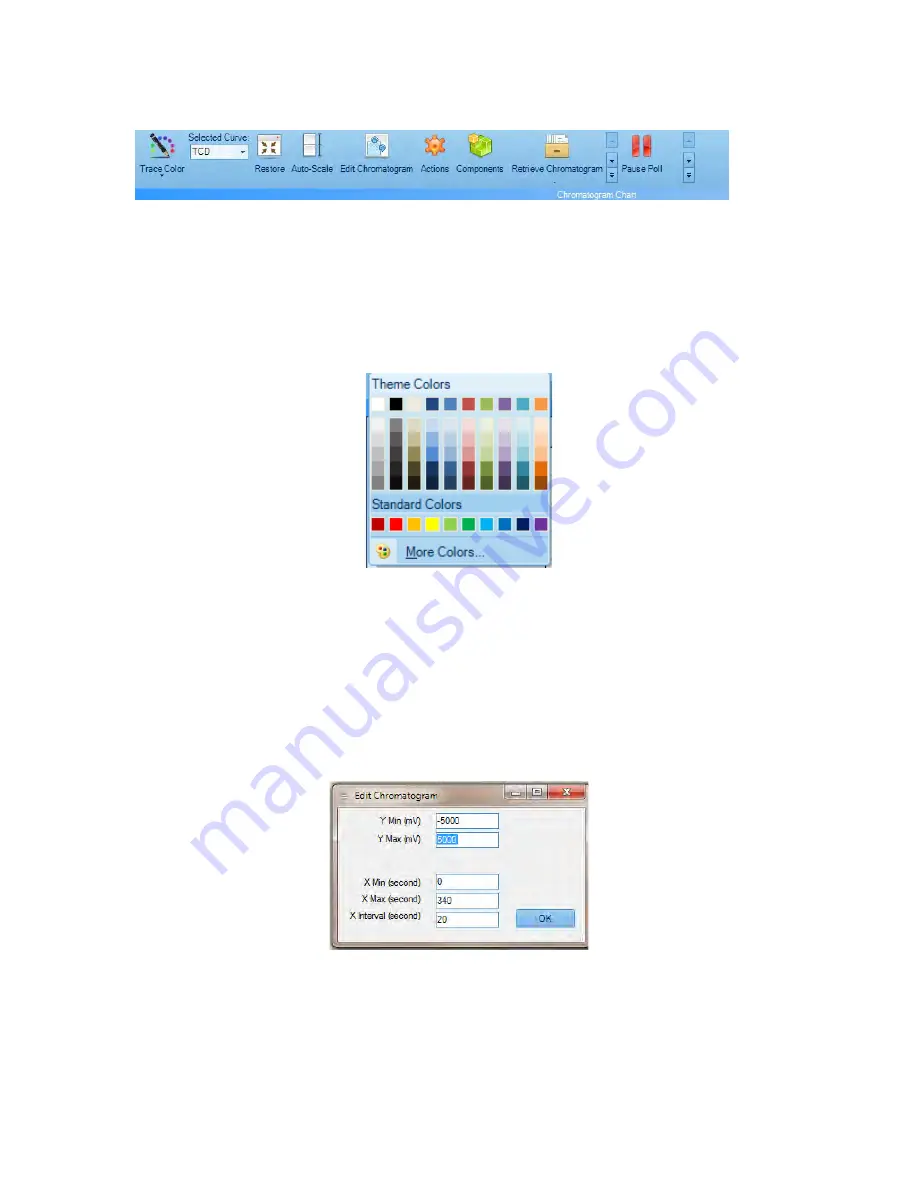
Figure 4-19: Chromatogram Tab Ribbon Bar
The
Ribbon Bar
on the chromatogram tab provides access to a number of commands to
present the chromatogram as desired.
•
Trace Color
– presents a palette of colors (Figure 4-20). To select the desired color for the
TCD trace, move the cursor to it and press the mouse button. This function is a standard
Windows feature.
Figure 4-20: Trace Color
•
Selected Curve
– this field indicates the active chromatogram when two or more
chromatograms are presented on the display. The active chromatogram can be selected by
pressing the ▼ arrow and clicking on the name.
•
Restore
– This restores a zoomed-in part of the chromatogram back to show the whole
chromatogram.
•
Auto-scale -
Scales the y-axis so that the largest peak is 75%
of full scale.
•
Edit Chromatogram
– presents a dialog box to set the x-axis and y-axis minimum and
maximum as well as the X axis interval (Figure 4-21).
Figure 4-21: Edit Chromatogram Dialog Box
Summary of Contents for AccuChrome MA2963
Page 21: ...Revision 4 8 12 15 2018 Figure 2 7 The Intrinsically Safe Barrier ...
Page 24: ...Revision 4 11 12 15 2018 Figure 2 10 4 Minute Analysis Flow Diagram ...
Page 58: ...Revision 4 45 12 15 2018 Figure 4 24 Chart Commands ...
Page 65: ...Revision 4 52 12 15 2018 A sample report is shown in Figure 4 32 Figure 4 32 Sample Report ...
Page 80: ...Revision 4 67 12 15 2018 Figure 5 10 Streams Setup ...
Page 104: ...Revision 4 91 12 15 2018 Figure 8 2 Enron Mode Short Integers ...
Page 140: ...Revision 4 127 12 15 2018 ...
Page 141: ...Revision 4 128 12 15 2018 15 2 Valve Maintenance Instructions ...
Page 142: ...Revision 4 129 12 15 2018 ...


