


EtherScope™ Series II
Getting Started Guide
74
4.
Tap
to begin the test.
As the test progresses, Throughput results are
continuously updated.
The local unit keeps track of the number of frames
sent, the percent received, and the percent loss for
both the local and remote units.
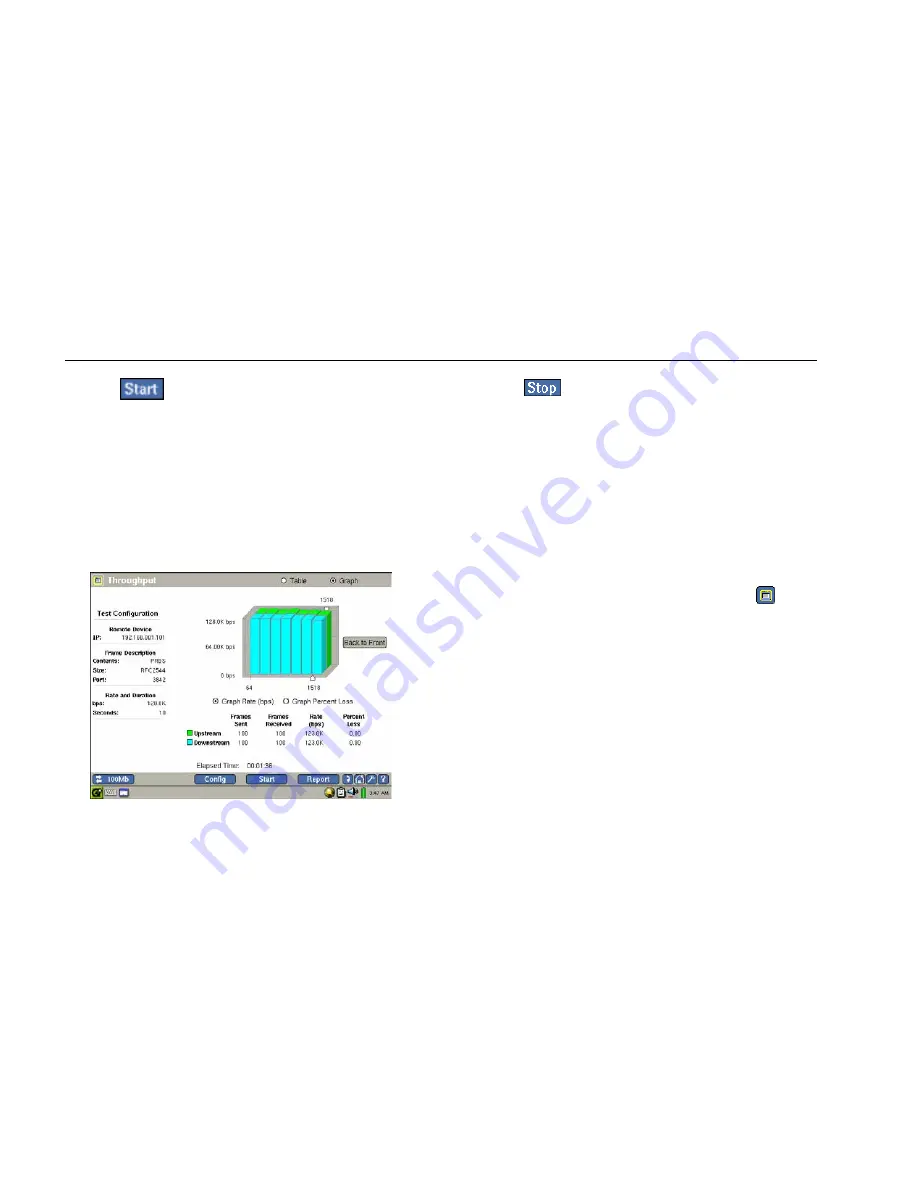
5.
To see results displayed graphically (see Figure 20),
tap Graph (located in the title bar).
epi72s.bmp
Figure 20. Throughput Test Results
6.
Tap
to end the test.
Configuring the Instrument for a Wired LAN
Although EtherScope Network Assistant is designed to
provide as much automated configuration as possible,
every network is different. For the instrument to provide
you with the best network analysis possible, you may
need to change some of the default configuration
settings.
To access the instrument’s configuration screens, do the
following:
1.
Tap the EtherScope Network Assistant icon
,
which is located in the upper-left corner of the
title bar.
2.
From the drop-down list, tap Instrument Settings.
The Instrument Settings —TCP/IP screen (Figure 21)
is displayed.
Test Equipment Depot - 800.517.8431 - 99 Washington Street Melrose, MA 02176
FAX 781.665.0780 - TestEquipmentDepot.com


