


Network Assistant
Monitoring and Troubleshooting a Wired LAN
61
epi49s.bmp
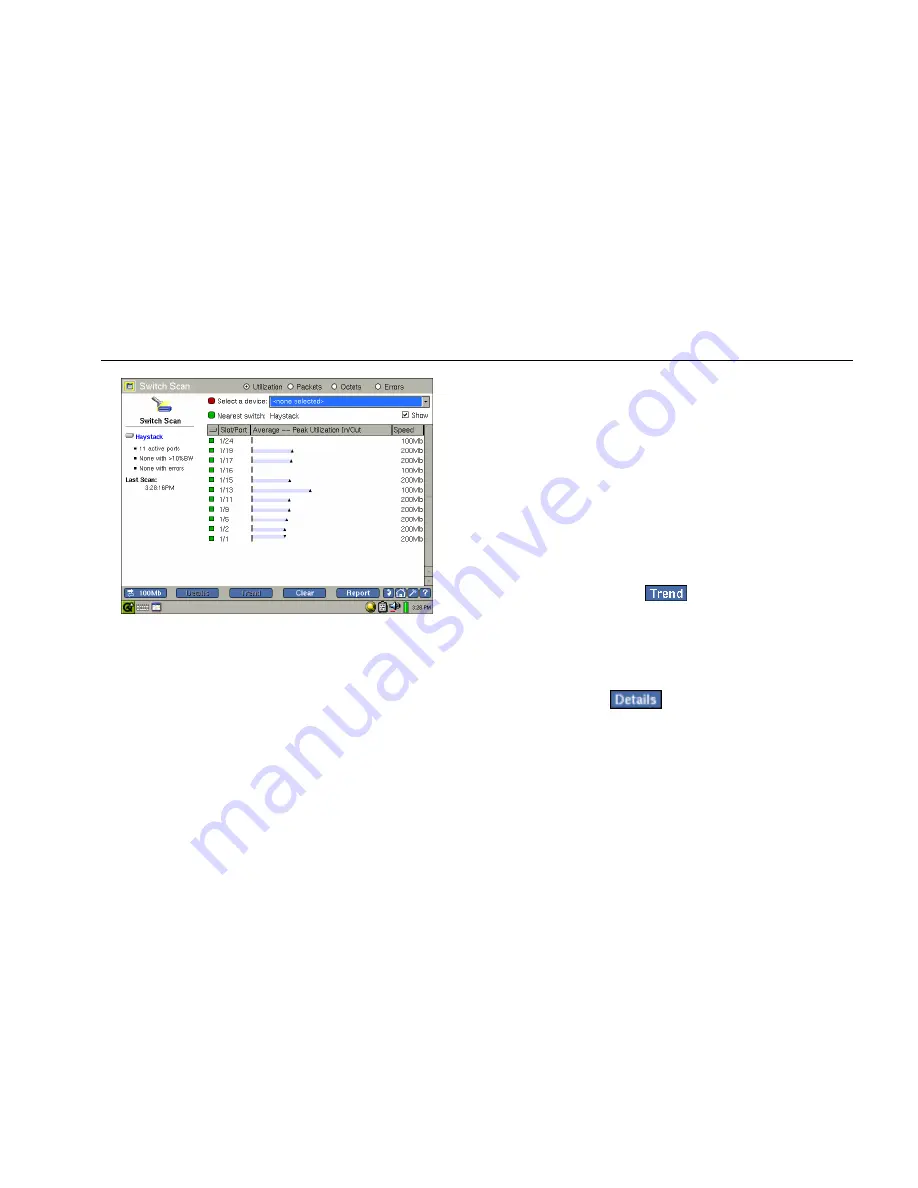
Figure 16. Switch Scan Screen
4.
To select an additional switch to scan, select it from
the Select a device box.
5.
By default, the nearest switch is monitored. To
prevent this switch from being monitored, tap (to
uncheck) the Show box.
6.
To view details for a particular interface:
a.
Select the desired interface.
The top portion of the preview pane shows
the port number, VLAN identifier, speed of
the interface, and number of connected
hosts. The lower portion displays a graph
that lets you see the relative percentage of
packets and bandwidth.
b.
If you want to see interface statistics over a
period of time, select the desired interface.
Then tap
.
The Utilization History is displayed. On this
screen, you can specify a time period during
which errors and utilization statistics for the
interface are gathered and reported.
c.
Tap
to obtain more detailed
information for the selected interface.


