


10 Graphing Records
D03283R01.10
TESLA LITE User Manual
10-55
Drag the thumb track on the scroll bar to zoom in or zoom out the axis range.
In the Time Window c click the arrow buttons or drag the thumb track
to scroll the window of visible data in the time domain.
To place the X and O markers use the tool bar or the right-click context menu
or the
View>Markers
option, dragging a marker to the right or left moves cor-
responding marker. If the Time Window control does not show the data, then
the markers are shown as small triangles on the left or right sides. If you click
the triangle, corresponding data cursor is displayed and the time range is auto-
matically adjusted.
You can save all the impedance display options to a template file (
File> Save
template
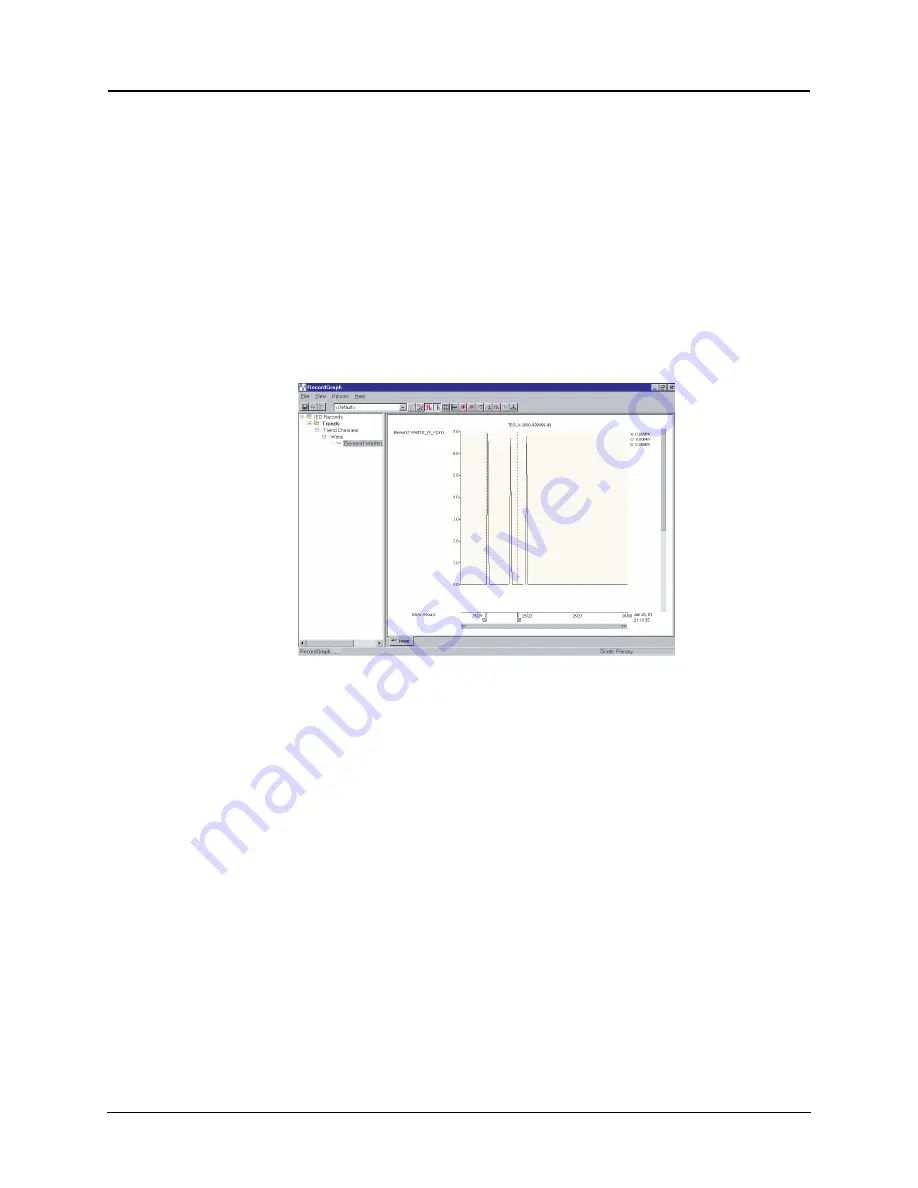
Trend View
Figure 10.82: Trend View
• Trend View is designed to display “trend” data.
• It has a special x-axis, common to all the graphs to display the data in the
“date” format. When zoomed, the scale automatically changes depending
on the date range. (For example: years/months or months/days or days/
hours or hours/minutes or minutes/seconds).
• Each analog graph in a trend view can display one trace.
• A maximum of 32 graphs can be added per view.
Summary of Contents for tesla lite
Page 1: ...TESLA LITE Power System Recorder User Manual Version 1 1 Rev 0 ...
Page 2: ......
Page 4: ......
Page 6: ......
Page 10: ......
Page 12: ......
Page 20: ......
Page 24: ......
Page 78: ......
Page 126: ......
Page 134: ......
Page 214: ......
Page 234: ......
Page 280: ......
Page 284: ......
Page 288: ......