China Electronics Technology Instruments AV3672 Series User Manual Download Page 75

3 Introduction to Use 

3.5 Data Analysis 

71 


failure of the bandwidth test. 

9) Tick the 

[Fail Sign on/OFF]

 check box in the dialog box. The 

FAIL 

prompt will be provided in case of failure 

of the bandwidth test. 

10) Click 

[OK]

. Thus the bandwidth test setting is completed. 


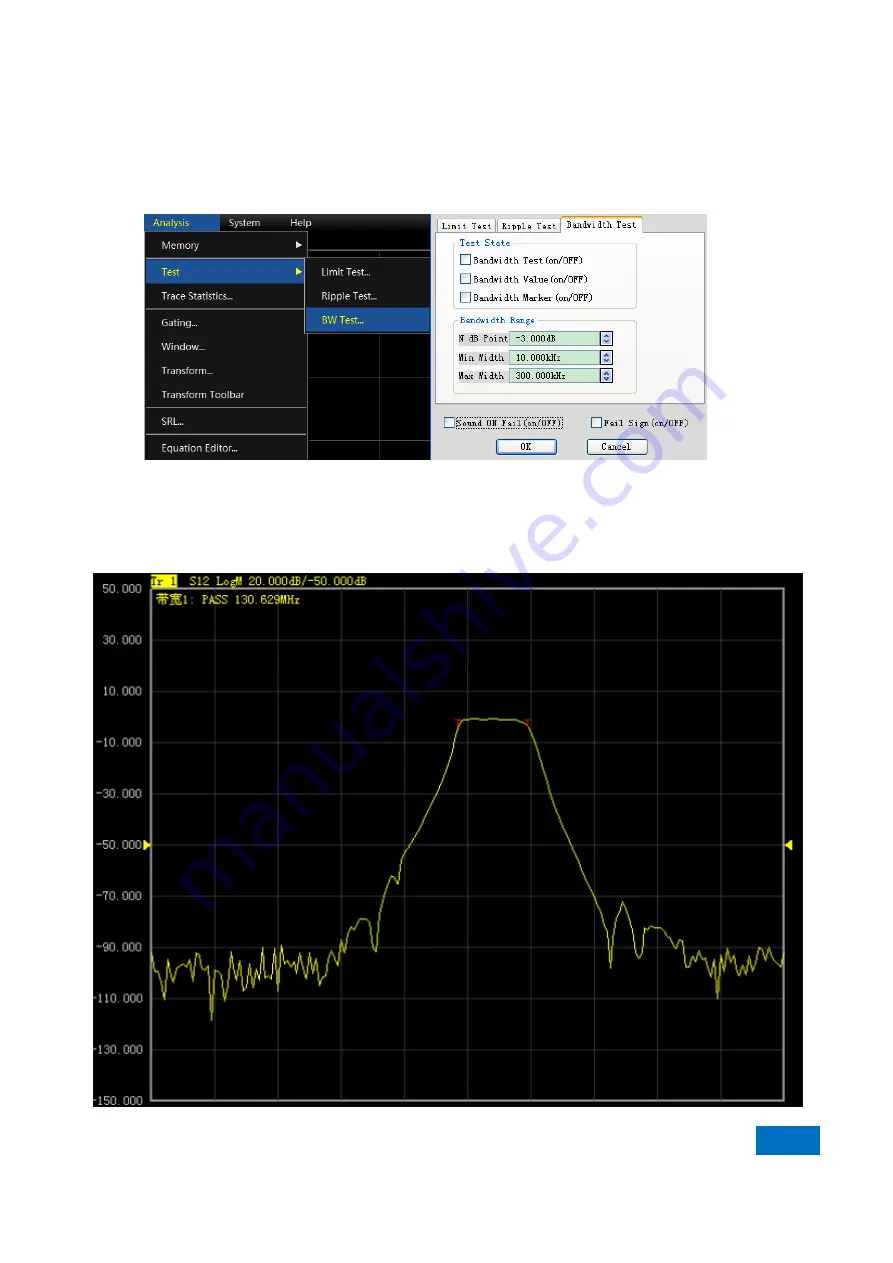
Fig. 3.65 Dialog Box of Bandwidth Test 

3.5.5.2 Display of Bandwidth Test Results 

Bandwidth  test  results  will  be  displayed  in  the  upper  left  corner  of  the  trace.  If  the  test  results  are  acceptable, 

PASS

” will be displayed. The red 

T

-type bandwidth marks will appear on both sides of the bandwidth. 


Summary of Contents for AV3672 Series

Page 1: ...AV3672 Series Vector Network Analyzer User Manual China Electronics Technology Instruments Co Ltd...

Page 2: ...omain measuring device Frequency offset measuring device Mixer scalar measuring device Mixer vector measuring device Embedded local oscillator converter measuring device Gain compression and two dimen...

Page 3: ......

Page 4: ...AV3672 Series Vector Network Analyzer Contents...

Page 5: ......

Page 6: ...r will repair or replace damaged parts according to the actual situation within the warranty period The user should return the product to the manufacturer and prepay mailing costs The manufacturer wil...

Page 7: ...tallation Procedures of Analyzer 31 3 1 3 Routine Maintenance 36 3 2 FRONT PANEL REAR PANEL 36 3 2 1 Front Panel 37 3 2 2 Rear panel 43 3 3 ANALYZER INTERFACE 50 3 3 1 Front Panel Interface 50 3 3 2 M...

Page 8: ...FORMAT AND SCALE 104 4 7 1 Data Format 104 4 7 2 Data Format Setting 107 4 7 3 Scale 107 4 8 OBSERVATION OF MULTIPLE TRACKS AND OPENING OF MULTIPLE CHANNELS 108 4 9 SETTING OF ANALYZER DISPLAY 111 4...

Page 9: ...ITY 199 6 9 INCREASE OF SWEEP VELOCITY 201 6 10 IMPROVEMENT OF EFFICIENCY OF MULTI STATE MEASUREMENT 203 6 10 1 Improvement of Measurement Efficiency by Measurement Setting 204 6 10 2 Automatic Change...

Page 10: ...rt Embed De embed 237 7 10 ELECTRONIC CALIBRATION 239 8 BASIS OF NETWORK MEASUREMENT 244 8 1 REFLECTION MEASUREMENT 244 8 1 1 Reflection Measurement Expression 244 8 1 2 Summary of Reflection Measurem...

Page 11: ...Function 261 8 8 5 Factors Related to Measurement Accuracy 261 8 8 6 Steps of Linear Phase Deviation Measurement 261 8 9 REVERSE ISOLATION 262 8 9 1 What is reverse isolation 262 8 9 2 Why to measure...

Page 12: ...ct us 307 10 4 2 Packaging and Mailing 308 11 TECHNICAL INDICATORS AND MEASUREMENT METHODS 309 11 1 TECHNICAL INDICATORS 309 11 1 1 Frequency Range 309 11 1 2 Frequency Accuracy 309 11 1 3 Frequency R...

Page 13: ...n 330 1 5 Connection of DUT 331 1 6 Scale Adjustment and Data and Analysis 331 1 7 Recording or Saving of Data 332 APPENDIX 2 TIME DOMAIN MEASUREMENT 334 2 1 Principle of Time Domain Measurement 334 2...

Page 14: ...ement 394 6 5 Vector Mixer Measurement Calibration 397 6 6 EMBEDDED LO MIXER MEASUREMENT 399 APPENDIX 7 INTERMODULATION DISTORTION MEASUREMENT 404 7 1 Concept of Intermodulation Distortion 404 7 2 Int...

Page 15: ...sis and saving of measurement data Measurement setting This chapter describes various settings of the network analyzer in operation including resetting of the analyzer selection of measurement paramet...

Page 16: ...ded test instructions for the user Appendix This section lists the instructions on software accessories of AV3672 vector network analyzers 1 2 Related Documents The documents related to AV3672 series...

Page 17: ...teristics of the instrument and understand basic settings and operations It mainly includes the following chapters Preparation for use Typical application Help Online help Online help is integrated in...

Page 18: ...eristics phase frequency characteristics and group delay characteristics of the microwave network The instrument can be widely applied in measurement of the transmission reception T R module dielectri...

Page 19: ...reen as shown in Fig 2 1 to facilitate operation Fig 2 1 12 1 inch 1280 800 Touch Screen The soft panel can be set on the left side or right side of the screen or hided to facilitate operation Fig 2 2...

Page 20: ...t traces can be displayed in each window and frequent state recalling is not required to measure several parameters of the DUT thus simplifying the test process Fig 2 4 Multi window Multi channel Meas...

Page 21: ...vely reduce the test cost in a flexible automation environment 1 The vector network analyzer is controlled with SCPI commands to complete automatic tests 2 Codes are directly executed from the vector...

Page 22: ...ease carefully read and strictly follow the notes for attention below We will spare no effort to ensure that all production stages conform to the latest safety standards to guarantee the highest safet...

Page 23: ...ions Power on off Caution handle heavy equipment Standby indication Danger Be careful of electric shock Direct current DC power Warning Be careful of surface heat Alternating current AC power Protect...

Page 24: ...r the power supply of the instrument 1 Ensure that the actual power supply voltage is the same as that marked on the instrument before powering on If the power supply voltage is changed replace the fu...

Page 25: ...help to eliminate the symptoms 4 Refer to relevant requirements in 2 2 8 Waste disposal environmental protection of this section before removing and disposal of the instrument 5 RF instruments may res...

Page 26: ...heavy instrument must be handled carefully If necessary use tools such as the crane to move the instrument to prevent damage to the body 2 The instrument handle is applicable to handling by individual...

Page 27: ...ing of the electromagnetic shielding performance damage to parts in the instrument etc thus affecting the product reliability In this case we will not provide free maintenance services even within the...

Page 28: ...owing steps Step 2 unpack the box and check whether the host and accompanying articles are damaged Step 3 carefully check the above articles according to Table 3 1 Step 4 Do not turn on the power supp...

Page 29: ...ude stabilized phase compensated cable used for overall measurement 3 5mm amplitude stabilized phase compensated cable used for overall measurement AV3672C accessory AV31123 calibrator FE0BN0BM025 0 F...

Page 30: ...rly grounded to prevent static electricity The internal and external conductor of the cable should respectively contact with the ground temporarily before the coaxial cable and instrument are connecte...

Page 31: ...protective ground wire and the ground wire of the power supply are in good contact before powering on to start the network analyzer Use the power socket with protective ground wire Do not use the exte...

Page 32: ...rogram you can run the measurement program again according to the following method Method 1 click Start of the task bar in the lower left corner of the screen Point to Program in the Start menu and th...

Page 33: ...e connector and reduce the measurement cost Pay attention to the following items in actual operation 1 Inspection of connector Wear the anti state wristband in connector inspection It is recommended t...

Page 34: ...ors during connection Fig 3 5 Connection Method Step 3 as shown in Fig 3 6 complete the final connection by tightening with the torque wrench Note that the torque wrench must not be beyond the initial...

Page 35: ...ate the instrument on the grounded conductive workbench mat to protect the analyzer and connectors from the influence of static release 7 Use of adapter If the type of the measurement port of the anal...

Page 36: ...and select System Recovery and press Enter of the keyboard to automatically recover the system Fig 3 9 Start up Screen Fig 3 10 System Recovery Screen 3 If the screen shown in Fig 3 10 appears system...

Page 37: ...3 Introduction to Use 3 1 Preparation before Use 33 Specific steps are shown in Fig 3 11 to 3 17 Fig 3 11 Start Interface of Installation Program Fig 3 12 License Protocol Interface...

Page 38: ...3 Introduction to Use 3 1 Preparation before Use 34 Fig 3 13 User Information Input Interface Fig 3 14 Interface of Installation Directory Selection...

Page 39: ...3 Introduction to Use 3 1 Preparation before Use 35 Fig 3 15 Interface of Installation Type Selection Fig 3 16 Installation Waiting Interface...

Page 40: ...diluted 2 Cleaning of display Clean the display after a certain period of use Follow the steps below Step 1 turn off the instrument by disconnecting the power line connected to the instrument Step 2...

Page 41: ...3672 series vector network analyzers The front panel is shown in Fig 3 18 Fig 3 18 Front Panel of AV3672 1 Input key zone The keys are used to enter measurement settings as shown in Fig 3 19 Fig 3 19...

Page 42: ...s as follows G n G ns 109 10 9 M M s 106 10 6 k m k ms 103 10 3 Basic units include dB dBm degree second Hz or dB GHz The keys can also be used to input values with no unit and have the functions of t...

Page 43: ...ment c Meas key Shortcut key for measurement It s used to set up measurement parameters of current trace It can set up S parameter and receiver in ordinary mode and can set up measurement parameters o...

Page 44: ...pen the main response menu The primary menu will be displayed in the auxiliary menu bar Measurement Format Scale Display and Average f Cal key Open the main calibration menu The primary menu will be d...

Page 45: ...nction of the analyzer Press the key to automatically start recording If recording is completed press this key to automatically start running This key is only effective for Record Run 1 and cannot be...

Page 46: ...state of the analyzer The indicator is green when the analyzer is started The indicator is orange when the analyzer is in the standby state Press the power button to start the analyzer Then the Windo...

Page 47: ...85mm male test ports for switching between the RF source and receiver so as to measure the DUT in two directions The yellow light is used to indicate the source output port Fig 3 27 Test Ports of Ana...

Page 48: ...requency 10MHz 1ppm Input level 15dBm to 20dBm Input impedance 200 b 10MHZ Ref Out The reference signal with the following features can be provided for the outside through the BNC female connector Out...

Page 49: ...nnector is mainly used for control The network analyzer can be connected to the external computer or remote device through SCPI control The rear panel is equipped with one interface Fig 3 32 USB Conne...

Page 50: ...used for LO output and RF output The LO interface is used for internal LO signal output and RF interface for RF source signal output The connector can be used for fault detection and millimeter wave...

Page 51: ...rt model is marked with A B R1 and R2 and the four port with A B C D and R Features are as follows Input impedance 50 RF input 23dBm DC input 5 5V 0 1dB compression point 9dBm Fig 3 37 External Medium...

Page 52: ...nal triggering 20 Output port B6 Index signal 21 Output port B7 Trigger Ready 30 31 Port C D State 32 Output port OK 33 Pass Fail state information 34 End of sweep 35 36 5V and Pass Fail state informa...

Page 53: ...r receive send data information 7 12 ground Reference ground wire 8 Address switch LAS The low level means that the address information is transmitted at present 24 Data switch LDS The low level means...

Page 54: ...e analyzer and includes the front panel interface and user interface Front panel interface 50 Mouse interface 51 3 3 1 Front Panel Interface As shown in Fig 3 43 the user can use the keys of the front...

Page 55: ...djust the entered number Click the cursor toolbar to use the marker Click the measurement toolbar to add the measurement trace Click the scanning toolbar to control sweep of the analyzer Click the exc...

Page 56: ...ection of Measurement Parameter Trace settings include Measured parameters Display format Scale Trace operation Marker Electrical delay Phase deviation Smoothing Time domain transformation 3 4 2 Chann...

Page 57: ...each window Set the window display by the View menu For details refer to 4 9 Stup of Analyzer Display 1 Create a new window Menu path Response Display Window New window Then a new window will be creat...

Page 58: ...3 5 1 Marker Use the marker to read the measurement data search the values of specific type or change the stimulus settings Nine normal markers and one reference marker can be used at most for each tr...

Page 59: ...ker box Set the marker stimulus value in the Stimulus box Click the Open check box Fig 3 48 Creation of Marker by Marker Dialog Box 2 Marker dialog box a Marker box Select the marker to be defined b S...

Page 60: ...arker stimulus value b Click the Stimulus box in the marker toolbar and move the marker in the following method i Directly enter the stimulus value ii Rotate the knob to move the marker iii Click the...

Page 61: ...h ranges set by users Fig 3 50 Schematic Diagram of Search Domains Set by Marker Users c User span The Start box and End box within the user span are used to define the search range set by the user d...

Page 62: ...ide until it reaches the maximum stimulus value In this case the marker will return to the lowest stimulus value to search the target value If the Discrete is selected in the Advanced dialog box the m...

Page 63: ...he screen so that the user can directly observe measurement results As manual setting in the test is eliminated the velocity of filter test is greatly increased As shown in Fig 3 51 Eight parameters o...

Page 64: ...s the start frequency stop frequency etc The setting method is as follows Menu path Marker Marker Functions Fig 3 54 Measurement Setting by Marker Function Dialog Box Prompt Soft key toolbar of marker...

Page 65: ...ker button The advanced marker dialog box will appear Fig 3 55 Advanced Marker Dialog Box 2 Advanced marker option dialog box a Marker box Select the marker to be set b Open check box If this check bo...

Page 66: ...ter filter tuning 3 5 1 6 Marker list 1 Marker list All marker data of the active data can be displayed by opening the marker list in the format specified for the corresponding data The marker list wi...

Page 67: ...e functions of trace statistics average offset and peak peak value 3 5 2 1 Trace Operation 1 Setting the method of trace operation One trace must be stored in the memory before setting the method of t...

Page 68: ...ory trace iii Data and Memory Trace option box Display the data and memory trace at the same time 3 5 2 2 Trace Statistics The analyzer has three functions of trace statistics average offset and peak...

Page 69: ...n the screen in the limit line form The limit lines have the following advantages Provide intuitive indicators for the device commissioning personnel Provide the standards of characteristic indicators...

Page 70: ...nd stop response value of the limit segment i e Y axis start and stop coordinates of the limit segment Limit type box Set the limit line display mode of the limit test SLOP display the slope limit lin...

Page 71: ...to the measurement data point will be indicated with the symbol v measurement type MAX and measurement type MIN Line option box If this box is selected all the discrete limit setting points will be c...

Page 72: ...ctuation box Set the maximum fluctuation of the test line of the ripple limit segment test 3 5 4 2 Setup of Ripple Test After creating the ripple limit line select the mode of displaying or hiding the...

Page 73: ...to close the ripple table display If the ripple table is closed this button will be disabled Export button Click it and the storage dialog box will pop up You can select the storage path and the file...

Page 74: ...the screen or the sound will be utters so that the user can intuitively check whether the properties of the DUT conforms to the requirements 3 5 5 1 Enabling and Setting of Bandwidth Test Set the ban...

Page 75: ...ilure of the bandwidth test 10 Click OK Thus the bandwidth test setting is completed Fig 3 65 Dialog Box of Bandwidth Test 3 5 5 2 Display of Bandwidth Test Results Bandwidth test results will be disp...

Page 76: ...tered by the user is composed of the basic operator built in function and parameters Measurement parameters or trace data used in the equation are provided by the vector network analyzer If a calculat...

Page 77: ...r in the menu of the vector network analyzer to open the equation editor dialog box as shown in Fig 3 69 Fig 3 69 Equation Editor Menu 2 How to enter the equation in the equation editor dialog box a F...

Page 78: ...tton Backspace used to delete one character in front of the marker If there is no character on the left side the marker position will remain unchanged 6 Leftward and rightward movement of marker used...

Page 79: ...a Return to the tangent value of the plural a The parameter a is a plural in radian 8 Operator selection Operations are shown in Table 3 11 The user can click the mouse to select the required operator...

Page 80: ...However if the entered equation cannot be used for calculation the original trace name will be displayed For example if Tr2 S11 is entered the original Tr4 S22 will be displayed on the current active...

Page 81: ...n to Use 3 5 Data Analysis 77 10 S22 the saved measurement parameter name will remain unchanged i e S22 The data will become the value of 10 S22 The equation trace cannot be saved as a data file in th...

Page 82: ...of the specified directory If the default file exists the dialog box to confirm whether to cover will appear 3 File menu item Save as Click Save as to save the file in the dialog box a Save as drop do...

Page 83: ...tion data are saved in the cal file excluding state data The correction accuracy of calibration data is associated with the state setting To realize the highest accuracy of measurement the instrument...

Page 84: ...alog box will appear b Set the file saving type as the data file dat in the Save as type box c Set the saving directory in the Save in box and File List box d Set the name of the file to be saved in t...

Page 85: ...s shut down the current active trace is S11 but S21 is still measured in the channel measurement results of S11 and S21 will be saved in the s2p file As no effective measurement data of S22 and S12 ar...

Page 86: ...mation will not be printed The following two check boxes are effectively only when the above check box is selected b Print one window on each page check box If this check box is selected only the info...

Page 87: ...ile Print Print The print setup dialog box will appear Fig 3 75 Printing of Measurement Information 3 6 2 3 Printing into File The analyzer supports the output of print contents into the bitmap bmp fi...

Page 88: ...ervation of multiple traces and opening of multiple channels 108 Setting of analyzer display 111 4 1 Resetting of Analyzer Default reset state 84 User reset state 87 Resetting of analyzer 87 4 1 1 Def...

Page 89: ...ale Reference position Reference value Logarithmic amplitude 10 dB 5 0dB phase 45o 5 0o Group delay 10ns 5 10fs Linear amplitude 100mU 5 500mU Standing wave ratio 1U 5 6U Real part 2U 5 0U Imaginary p...

Page 90: ...ine display closed c FAIL sound warning closed 12 Limit table setup a Type OFF b Initial stimulus 10MHZ c Stop stimulus 13 5GHz 26 5GHz 43 5GHz 50GHz 67GHz d Initial response 100dB e Stop response 100...

Page 91: ...te and tick the check box Notes a If you tick Save final state as user preset the final state before exiting the program will be saved as the user reset state b Click Save current state as user state...

Page 92: ...ber of the DUT and the input refers to the input signal port number of the DUT The analyzer is equipped with four test ports to test single port double port three port and four port devices For exampl...

Page 93: ...ain iv Group delay v SXY The measurement of the double port device with Port 1 and 2 is taken as an example below to introduce the parameter S Fig 4 3 Definition of Parameter S 3 New S measurement tra...

Page 94: ...If this check box is selected a trace will be created in the new window If this check box is cleared a trace will be created in the current active window 4 2 2 Any Ratio The input signal and referenc...

Page 95: ...box is cleared a trace will be created in the current active window g Auto Create Window check box If this check box is ticked and the number of traces in the window exceeds 8 excessive traces will be...

Page 96: ...Frequency shortcut key The frequency can be rapidly set with the Frequency shortcut key in the functional key zone of the front panel 4 4 Setting of Signal Power Level The power level refers to the po...

Page 97: ...al setting of attenuation Menu path Stimulus Power Power and Attenuators The Power and Attenuators will appear Click to clear the Auto zone check box Click the Attenuation input box and enter the atte...

Page 98: ...zer c State bar It is Auto in the default mode In this case the power ON OFF state can be switched according to the measurement needs ON indicates the port power is always ON while OFF indicates the p...

Page 99: ...cy The maximum sweep range is 50dB The default frequency sweep range is 25dBm to 20dBm 4 Point frequency In the point frequency sweep mode a single sweep frequency is set in the analyzer measurement d...

Page 100: ...pendent intermediate frequency bandwidth of each segment c Independent Sweep Time check box tick it to set the independent sweep time of each segment d Show Table button click it to create and edit th...

Page 101: ...segment and set the sweep time the independent sweep time option is opened 4 5 3 Sweep Time After setting of measurement the minimum sweep time will be adopted by the analyzer The sweep time can be i...

Page 102: ...e d Sweep Delay input box Set the waiting time of the analyzer before obtaining the measurement data It refers to the delay before measurement of the first point e Fast Sweep check box If the Fast Swe...

Page 103: ...4 Measurement Setting 4 6 Trigger Mode 99 Fig 4 16 Simple Trigger Setting 4 6 2 Detailed Trigger Setting Menu path Stimulus Trigger Trigger The trigger dialog box will appear Fig 4 17 Trigger Sub menu...

Page 104: ...Internal default 1 Trigger signal generation is controlled automatically by the analyzer 2 One trigger signal is generated immediately after one measurement Manual The manual trigger signal is genera...

Page 105: ...he channel will receive one trigger signal Sweep will be done once and then the channel will enter the holding mode Hold The channel will not receive the trigger signal and sweep will be stopped Spot...

Page 106: ...rnal trigger output of the corresponding channel otherwise the external trigger output will be closed Polarity Set the polarity of the trigger output signal in the radio box Positive pulse or Negative...

Page 107: ...nt interface 2 External the pulse repetition period specified by the user is ignored One pulse train will be output once an effective external pulse synchronization signal is detected by the analyzer...

Page 108: ...the most favorable to understand the characteristics of the DUT This section introduces nine data formats and the method of scale setting so as to better display the measurement information Data forma...

Page 109: ...mat Display the signal transmission time through the DUT Y axis unit time second Applicable typical measurement group delay d Linear amplitude format Only display the positive value Y axis no unit U i...

Page 110: ...of any point is determined by the displacement of this point relative to the central point or zero point In the default mode the amplitude is a linear scale and the excircle scale is set as 1 b The p...

Page 111: ...is infinite indicating an open circuit b The points on the intersecting circle of Smith chart and horizontal axis have the same resistance c The points on the tangent of Smith chart and horizontal ax...

Page 112: ...iate scale factor will be selected so that data are displayed in 80 of the screen ii The center value of the trace on the screen will be selected as the reference value Auto All button Click the Auto...

Page 113: ...annel 1 S11 will be displayed in Window 1 S21 in Window 2 S12 in Window 3 and S22 in Window 4 Setup C Three traces will be created in three windows of Channel 1 S11 will be displayed in the Smith char...

Page 114: ...the window b The display menu of the analyzer provides four kinds of window arrangement The existing traces are distributed into different windows according to a certain algorithm One window arrangeme...

Page 115: ...17 4 9 1 State Bar 1 The opened state bar will be displayed at the bottom of the screen including the following contents Current active channel Measurement parameter of active trace Mathematical opera...

Page 116: ...rs can be displayed at the same time Measurement can be easily set through the toolbar a Input toolbar Input the value through the input toolbar to set the measurement parameter b Marker toolbar Set a...

Page 117: ...Single sweep Continuous sweep e Stimulus toolbar f The stimulus toolbar is used to observe set and modify the sweep stimulus including Start stimulus value CW frequency in the CW mode Stop stimulus va...

Page 118: ...window Only one table can be displayed in each window a Marker table Fig 4 32Marker Table The marker table is used to display the marker parameters including Marker number Reference marker for relativ...

Page 119: ...tely set for each segment Sweep time separately set for each segment 2 Triggering of table display Menu path Response Display Point to the Tables in the display sub menu Click the table to be triggere...

Page 120: ...button and right click the mouse Delete the trace or set the trace scale color and line through the right click menu c Frequency stimulus state The frequency stimulus information will be displayed und...

Page 121: ...Display Contents 4 9 5 Title bar The title bar includes the application program title bar and window title bar including the title name and window control button Click Hide title bar to hide all titl...

Page 122: ...3672 series vector network analyzers is divided into the main menu primary menu secondary menu etc The analyzer can be directly and partially set and operated through the menus at all levels The setti...

Page 123: ...5 Menu 5 1 Menu structure 119 Note Press the menu with an ellipsis to open the corresponding dialog box the same below Fig 5 1 File Menu...

Page 124: ...5 Menu 5 1 Menu structure 120 5 1 2 Track Fig 5 2 Track Menu...

Page 125: ...5 Menu 5 1 Menu structure 121 5 1 3 Channel Fig 5 3 Channel Menu...

Page 126: ...5 Menu 5 1 Menu structure 122 5 1 4 Excitation Fig 5 4 Excitation Menu I...

Page 127: ...5 Menu 5 1 Menu structure 123 Fig 5 5 Excitation Menu II...

Page 128: ...5 Menu 5 1 Menu structure 124 Fig 5 6 Excitation Menu III...

Page 129: ...5 Menu 5 1 Menu structure 125 5 1 5 Response Fig 5 7 Response Menu I...

Page 130: ...5 Menu 5 1 Menu structure 126 Fig 5 8 Repsonse Menu II...

Page 131: ...5 Menu 5 1 Menu structure 127 Fig 5 9 Response Menu III...

Page 132: ...5 Menu 5 1 Menu structure 128 Fig 5 10 Response Menu V Fig 5 11 Response IV...

Page 133: ...5 Menu 5 1 Menu structure 129 5 1 6 Calibration Fig 5 12 Calibration Menu...

Page 134: ...5 Menu 5 1 Menu structure 130 5 1 7 Marker Fig 5 13 Cursor Menu I...

Page 135: ...5 Menu 5 1 Menu structure 131 Fig 5 13 Cursor Menu II...

Page 136: ...5 Menu 5 1 Menu structure 132 Fig 5 15Marker Menu III...

Page 137: ...5 Menu 5 1 Menu structure 133 5 1 8 Analysis Fig 5 16 Analysis Menu I...

Page 138: ...5 Menu 5 1 Menu structure 134 Fig 5 17 Analysis Menu II...

Page 139: ...5 Menu 5 1 Menu structure 135 Fig 5 18 Analysis Menu III...

Page 140: ...5 Menu 5 1 Menu structure 136 5 1 9 System Fig 5 19 System Menu I...

Page 141: ...5 Menu 5 1 Menu structure 137 Fig 5 20 System Menu I...

Page 142: ...calibration setting Marker used for relevant operations of the marker system Analysis used for analysis and statistics of test results and relevant setting of the time domain function System used for...

Page 143: ...de of the auxiliary menu bar including the commonly used menus Drag the shortcut bar push pull button on the left side of the auxiliary menu bar to display and hide the shortcut menu bar and auxiliary...

Page 144: ...description None 3 Save data as Function description Save the file required by the user The parameters required by the user will be saved in different types of files The user can set the file name Fi...

Page 145: ...ng to the prompts Parameter description None 3 Page Setup Function description Click this menu to enter the page setting interface The window information and other information can be set on this page...

Page 146: ...able Table 5 5 Delete trace Menu Delete trace 1 Delete trace 2 Delete trace 3 Delete trace 4 Delete active trace Delete trace 1 Delete trace 1 Delete trace 4 Function description Click it to rapidly d...

Page 147: ...the Channel menu item on the user interface and the channel related menu will pop up for setting of channel parameters Specific items include Open channel Close channel Select channel Copy channel and...

Page 148: ...the menu of lower level as shown in the following table Table 5 6 Hardware Setting Menu Path configuration Graphic configuration 1 Path configuration Function description Click this menu to configure...

Page 149: ...the start frequency should be equal to the stop frequency 1 Freq Start Function description Set the start point of the sweep frequency Set and adjust the parameter by the mouse keyboard or the knob n...

Page 150: ...ppendix 3 Frequency Offset Measurement Parameter description None 6 CW Function description Set the CW frequency Set and adjust the parameter by the mouse keyboard or the knob number keys and stepping...

Page 151: ...rol Pulse Segment table Segment table ON OFF Add segment Insert segment Delete segment Independent power levels ON OFF Independent IF bandwidth ON OFF Independent sweep time ON OFF 1 Sweep time Functi...

Page 152: ...e test port including the start phase stop phase phase ON OFF etc Parameter description 0 0 360 6 Pulse Function description Set the pulse measurement function See details in Appendix 4 Pulse Measurem...

Page 153: ...the selected segment Parameter description None e Independent power levels ON OFF Function description Allow to set different power levels for different segments Parameter description OFF OFF ON f Ind...

Page 154: ...Function description If this menu is selected the system will automatically enter the holding mode after the set sweep process Parameter description None 4 Continuous Function description If this menu...

Page 155: ...f lower level The specific menu includes Table 5 12 Measurement Menu Measurement S parameter Measurement balance parameter Measuring type Receivers 1 Measurement S parameter Function description Selec...

Page 156: ...Polar Positive phase Imped Format 1 Log Mag Function description Select this menu to sweep in the logarithmic format Parameter description None 2 Phase Function description Select this menu to displa...

Page 157: ...splay the standing wave ratio curve Parameter description None 8 Real Function description Select this menu to display the real part curve Parameter description None 9 Imaginary Function description S...

Page 158: ...n If this menu is selected the vertical scale will be selected automatically so that the active trace can be better displayed in the vertical grid of the screen The stimulus is not affected and only t...

Page 159: ...use keyboard or the knob number keys and stepping keys on the front panel Parameter description 0 1000 to 1000 6 Amplitude deviation Function description Select this menu to set the amplitude deviatio...

Page 160: ...n Window 2 S12 in Window 3 and S22 in Window 4 Three traces will be created in three windows of Channel 1 S11 will be displayed in the Smith chart format in Window 1 S22 in the Smith chart format in W...

Page 161: ...arker toolbar measurement toolbar sweep toolbar stimulus toolbar and time domain toolbar Parameter description None 9 Title bar ON OFF Function description Select this menu to display the title bar Pa...

Page 162: ...se reduction effect of sweep averaging is the same as that of reduction of the intermediate frequency bandwidth Parameter description OFF OFF ON 4 Smoothing This menu is used for smoothing setting Cli...

Page 163: ...Percentage 5 1 100 Frequency range Ffrequency span Ffrequency span between two points Ffrequency span 6 IF bandwidth Function description Select this menu to set the intermediate frequency bandwidth...

Page 164: ...e delay phase shift caused by the clamp can be compensated by port extension For the method of port extension setting refer to the section of port extension in 5 5 Improvement of Phase Measurement Acc...

Page 165: ...n refer to 7 9 6 4 port de embedding embedding in 7 9 Fixture Compensation Calibration Parameter description None 5 2 6 6 Editing of Calibration Kit Function description Select this menu to define and...

Page 166: ...ble the function of Marker 1 2 3 Read the measurement data search the value of specific type or change the stimulus setting Parameter description None 2 Reference marker Function description Select th...

Page 167: ...scription None 3 Marker center Function description Select this menu to set the frequency of the active marker as the center frequency Parameter description None 4 Marker span Function description Sel...

Page 168: ...or marker search of the maximum measurement data point Parameter description None 2 Minimum value Function description Select this menu for marker search of the minimum measurement data point Paramete...

Page 169: ...knob number keys and stepping keys on the front panel Parameter description 100dB 500dB to 500dB f Deviation Function description Select this menu to define the minimum vertical distance between the p...

Page 170: ...eyboard or the knob number keys and stepping keys on the front panel Parameter description 3dB 500dB 500dB c Tracking ON OFF Function description Select this menu to enable the bandwidth search tracki...

Page 171: ...s menu to set the filter bandwidth level Set and adjust the parameter by the mouse keyboard or the knob number keys and stepping keys on the front panel Parameter description 3dB 500dB 500dB c Frequen...

Page 172: ...type Normal the X axis position of the standard marker is fixed and the Y axis position changes along with the amplitude of trace data The marker can be moved right and left on the X axis by changing...

Page 173: ...lect this menu to enable the function of one marker for one trace Parameter description OFF OFF ON 3 Large font ON OFF Function description Select this menu to enable the function of large font displa...

Page 174: ...of menu items is as follows 5 2 8 1 Save This menu is used to save the settings Click it to enter the menu of lower level The specific menu includes Table 5 27 Save Menu Data Memory Normalization Trac...

Page 175: ...ameter description None 7 Hide trace Function description Select this menu to hide the data trace and memory trace Parameter description None 5 2 8 2 Test This menu is used to set the test Click it to...

Page 176: ...Parameter description OFF OFF ON 2 Ripple test This menu is used to set the ripple test Click it to enter the menu of lower level The specific menu includes Table 5 30 Ripple Test Menu Ripple test ON...

Page 177: ...be added deleted and edited Parameter description None f Fail Sign ON OFF Function description Select this menu to enable the FAIL sign function In case of failure of the trace data point test the FAI...

Page 178: ...s menu to set the allowable minimum bandwidth If the test bandwidth is less than the minimum value the prompt of bandwidth test failure FAIL will appear on the screen or the prompt sound will be sent...

Page 179: ...to enter the interface of curve trace statistics Three functions of trace statistics are provided average value deviation value and peak peak value so as to calculate the statistical values within wh...

Page 180: ...alue of the gate Parameter description 20ns 0ns 29 651594ns 6 Gate setup Function description Select this menu to enter the window of time domain transformation function The time domain transformation...

Page 181: ...ction description Select this menu to set the stop time Parameter description 10ns 14 825797ns 14 825797ns 4 Center time Function description Select this menu to set the center time Parameter descript...

Page 182: ...bserve the influence of setting changes on measurement Parameter description OFF OFF ON 5 2 8 7 Structural Return Loss This menu is used to set the structural return loss Click it to enter the menu of...

Page 183: ...description OFF OFF ON 5 2 9 System Press the System key on the front panel or the System menu item on the user interface The system related menu will pop up Specific items include Configuration Reco...

Page 184: ...the current time name Not automatically save after calibration Display marker on all the existing traces Display limit test on all the existing traces Press the UP DOWN key to change the marker point...

Page 185: ...y to automatically start running Parameter description None 5 2 9 4 Windows Task Bar Function description Select this menu to open the operating system task bar Parameter description None 5 2 9 5 Rese...

Page 186: ...ual of AV3672 Series Vector Network Analyzers Parameter description None 5 2 10 2 Programming Manual Function description Select this menu to open the Program Control Manual of AV3672 Series Vector Ne...

Page 187: ...ed The defined ratio dB GHz can be used in this function to increase the source power of the analyzer The process of cable loss compensation is as follows Menu path Stimulus Power If the power slope f...

Page 188: ...brated Therefore the load matching error must be minimized Connect the unmeasured port in the following methods Connect the unmeasured port of the DUT to one high performance terminal load the calibra...

Page 189: ...ASWR 1 05 024 Return loss 32 26dB Calculation without attenuator with attenuator Error in the worst case EWC NA NA Attn 1 01 019 029 Upper limit of instability 20log FRL EWC NAD 20log FRL EWC NAD 20l...

Page 190: ...d if the response of the DUT is at least 10dB more than the base noise The following methods can help to increase the dynamic range Attention Dynamic range and measurement time As some analyzers have...

Page 191: ...can change the received signal from the RF microwave frequency into the intermediate frequency 7 606MHz The bandwidth of the intermediate frequency band pass filter can be reduced from 5MHz to 1Hz min...

Page 192: ...Results of Long Device of Each Point The frequency of the signal from the DUT may be different from the frequency of the signal into the DUT at the given time This may result in inaccurate measurement...

Page 193: ...oint number in the sub menu or click Custom Enter the value in the Points dialog box or select the value with the arrow 2 Use of step sweep Change analog sweep into step sweep so that the source can s...

Page 194: ...device or short circuit device can be used instead of the DUT on the reference plane after extension Generally the new reference plane is regarded in the open circuit state after removal of the DUT 3...

Page 195: ...t of the system Coaxial set the coaxial characteristics of the current port extension Waveguide and Cutoff Freq set the waveguide characteristics of the current port extension In this case the cutoff...

Page 196: ...match select it to automatically compensate the error arising from mismatch Prompt for Each Standard if this item is selected the Calculation kit connection prompt box will pop up Close apply the curr...

Page 197: ...51 points and the group delay is negative But this is impossible in the actual situation as the response will not be below the reference line 0s b The second figure shows the measurement results of 2...

Page 198: ...n the Teflon medium Prompt You can perform the following operation to check whether the sufficient delay is added Connect one short circuit device Adjust the port extension until the phase correspondi...

Page 199: ...weep operations The times of continuous sweep are determined according to the setting of the average factor c The average value of traces will be applied on all measurements of one channel and the ave...

Page 200: ...is span Prompt Use of the smoothing function Use sufficient points in the display to avoid misleading results The smoothing function must not be applied to the highly resonant device or the device sub...

Page 201: ...from the network analyzer can change the received signal from the RF microwave frequency into the intermediate frequency 7 606MHz The bandwidth of the intermediate frequency band pass filter can be r...

Page 202: ...mber of sweep points and the scale Instead it is affected by other factors such as the flyback time data calculation formation time etc Refer to the technical specifications for the influence of the p...

Page 203: ...rement environment The following factors have adverse effects on the measurement accuracy 1 Frequency offset The frequency precision of the analyzer depends on the accuracy of the internal 10MHZ oscil...

Page 204: ...on method c Do not move the cable during measurement 5 Apply the external reference frequency Input the external frequency reference signal to the rear panel connector a Input frequency 10MHz 10ppm b...

Page 205: ...of noise reduction Reasonably set the following two items to reduce the sweep time but obtain the acceptable measurement results Intermediate frequency bandwidth use the largest intermediate frequency...

Page 206: ...pear Click Delete trace in the right click menu Fig 6 19 Deletion of Unnecessary Trace b Close the unnecessary marker Menu path Marker Marker Active Marker Off Select the marker to be closed Fig 6 20...

Page 207: ...function Fig 6 22 Shutdown of Limit Test e Shutdown of trace operation function Menu path Analysis Memory Math Memory Select the data in the Data Math box Fig 6 23 Shutdown of Track Operation Functio...

Page 208: ...diate frequency bandwidth Number of sweep point A group of frequency ranges with respective attributes can be defined in segment sweep In this case the DUT with multiple measurement settings can be me...

Page 209: ...t effective method to recall the measurement is to save a group of measurements as one instrument state The time difference of recalling the instrument with one or more measurements is little The corr...

Page 210: ...ssion velocity in the automatic SCPI measurement application 6 11 5 Use of COM Program Use COM in the automatic measurement program to achieve the highest velocity of data transmission 6 12 Use of Mac...

Page 211: ...display the complete macro title in the current toolbar button the number of title characters should not exceed 14 The macro title can be associated with the executable file It is better to describe...

Page 212: ...t toolbar Four macros will be displayed in the toolbar each time If Macro local is pressed four macros will be displayed 7 DOWN button Click it to move the selected macro down for one line 6 12 3 Macr...

Page 213: ...ation can be done according to the calibration guide of the calibration See details in 7 3 Calibration Guide The measurement accuracy after calibration depends on the quality of the calibration standa...

Page 214: ...types with details as follows 1 Open circuit response a Calibration accuracy low to medium b Measurement parameter S11 S22 S33 and S44 c Standard calibration kit open circuit device d System error co...

Page 215: ...s are not respectively connected with one load at the same time 5 One port reflection a Calibration accuracy high b Measurement parameter S11 S22 S33 and S44 c Standard calibration kit open circuit de...

Page 216: ...ffective only in transmission measurement Enable the calibration guide for calibration 1 Menu path Cal Calibration The Calibration guide dialog box will appear Fig 7 1 Enabling of Calibration 2 Click...

Page 217: ...the cable click Through and THRU After connection click OK The standard calibration kit button in the THRU Resp and Isol dialog box will become green after through type calibration Modify the frequenc...

Page 218: ...the calibration standard must be selected properly 7 4 High accuracy Measurement Calibration The calibration accuracy depends on the selected calibration type calibration kit quality and calibration p...

Page 219: ...f the impedance device not 50 such as the waveguide device The default system impedance is 50 a Setting of system impedance Menu path System Configuration Impedance Enter the system impedance value in...

Page 220: ...nly caused by the base noise inside the instrument and phase noise of the LO source b The random noise error can be reduced in the following methods Increase the source power input into the DUT Reduce...

Page 221: ...urce matching errors Ideally the measurement receiver can receive all signals reflected from the DUT in reflection measurement Actually part of the signals reflected by the DUT are reflected by the me...

Page 222: ...circuit device and short circuit device to determine source matching errors Eliminate reflection tracking errors by means of error correction in reflection and transmission measurement 6 Transmission...

Page 223: ...t device short circuit device and load in one port calibration Improve the accuracy of the predefined calibration kit model If the actual properties of the standard calibration kit can be described wi...

Page 224: ...fine all standard calibration kits among custom calibration kits 7 6 4 Edit calibration kit 1 Click Cal Edit calibration kit The Edit calibration kit dialog box will appear 2 Click the calibration kit...

Page 225: ...ton Click the and button to select the calibration kit 7 6 5 Edit Kit Dialog Box Fig 7 10 Edit calibration kit Dialog Box 1 Calibration kit identification zone a Kit Number box Display or edit the ID...

Page 226: ...of the calibration kit 4 Standard zone a Cal Kit box Display the ID name and description of the calibration kit supported by the analyzer at present b Add button The Add standard dialog box will appe...

Page 227: ...nector 2 Frequency Range a Min Freq box Define the allowable minimum frequency of the standard calibration kit in calibration b Max Freq box Define the allowable maximum frequency of the standard cali...

Page 228: ...ation kits in the Selected standard box All the standard calibration kits in the Selected standard box will appear in the Measurement of multiple standard kits dialog box Select the corresponding stan...

Page 229: ...in calibration b Max Freq box Define the maximum working frequency of the open circuit device in calibration 3 Connector zone Define the connector polarity of the open circuit device male female or no...

Page 230: ...x Fig 7 16 Short circuit device Dialog Box 1 Short Characteristics Define the residual inductance of the short circuit device with L0 L1 L2 and L3 7 6 11 Load Dialog Box Fig 7 17 Load Dialog Box 1 Loa...

Page 231: ...ly known or predicted according to the frequency change amplitude and phase response To use the definition of the standard calibration kit the response value must be defined mathematically Then the ca...

Page 232: ...unit 1GHz Respectively measure the loss and delay time of the standard calibration kit at 1GHz and calculate the loss by the following equation h Fringe capacitance model of open circuit device The o...

Page 233: ...ined accurately can be used to establish the measurement reference plane b Reflection standard reflection kit The reflection standard calibration kit is a physical device of large reflection coefficie...

Page 234: ...en the measurement end face and DUT end face which is defined in the Touchstone data file so as to extend to the corresponding calibration surface The port matching function is used to transform the o...

Page 235: ...e component and circuit design phase Generally the conjugate matching circuit is composed of the resistance R inductance L capacitance C and conductance G in the impedance matching design The paramete...

Page 236: ...atching drop down menu Select the port number of the matching circuit embedded into the vector network b Circuit Parameter drop down menu Select the embedded matching circuit type The network analyzer...

Page 237: ...e shunt capacitance Fig 7 24 Five Parameter Types of Embedded Matching Circuit c Custom button This is not available in the default mode If User is selected in the Matching circuit type drop down menu...

Page 238: ...ected in the Matching Circuit Type drop down menu this button will be available Click this button to reset all the contents in the Circuit Parameter Model Setup edit box g Port matching on OFF check b...

Page 239: ...tic Diagram of Fixture De embedding take the double port DUT as an example 1 2 port De embedding dialog box a Port selection drop down menu Select the vector network port number of the fixture to be d...

Page 240: ...log box to enable the double port fixture de embedding function Click the Port selection drop down menu and select the port for fixture de embedding Select the de embedding type in the drop down menu...

Page 241: ...ps of port Z conversion Menu path Cal Fixtures Click Port Z Conversion in the Fixtures sub menu The Port Z Conversion dialog box will appear Tick the Impedance Conversion on OFF button in the dialog b...

Page 242: ...re Embedding De embedding b Network drop down menu The network embedding de embedding type is the first item of the drop down menu of Network 1 Network 2 is enabled in Mode C The drop down menu includ...

Page 243: ...ronic calibration is a process to obtain system errors by means of standard measurements of the electronic calibration kit through the network analyzer and calculation according to the fixed value of...

Page 244: ...lectronic Calibration Kit Attention Precautions of electronic calibration 1 Do not disconnect or insert or connect the USB interface equipment during communication with the USB interface Do not pull d...

Page 245: ...libration kit reaches the set temperature the red READY indicator will be ON the preheating time is related to the ambient temperature B According to the characteristics of the DUT set the frequency r...

Page 246: ...nction You can select whether to tick the Auto Check function in the calibration selection combined box If this option is ticked default the vector network analyzer can test the connection of the port...

Page 247: ...results after measurement Fig 7 39 Completion of Calibration Step 8 Connect the test cable and check the through curve S21 after calibration You can roughly observe whether calibration is successful...

Page 248: ...ll be reflected if the impedance of two connectors is different from each other Reflection measurement is a process to measure the ratio of the reflected signal and incident signal The incident signal...

Page 249: ...evice or short circuit device all the energy will be reflected 1 There is no unit of measurement for Below is the phase information of reflection If the signal wavelength is larger than the conductor...

Page 250: ...e figure is not approaching zero and the peak is smaller than that of the open circuit device and short circuit device Fig 8 5 Signal Transmission of Transmission Line Connected through 25 Resistor 8...

Page 251: ...e communication system signal distortion must be within the normal limits The signal distortion can be divided into two types 1 Linear distortion refer to the failure to keep the flat amplitude and li...

Page 252: ...se distortion of the device The transition time of the signal of specific frequency through the device is measured and the group delay is calculated according to the derivative of the measured phase r...

Page 253: ...ent only the stimulus signal is applied to the output end of the amplifier See details in 8 9 Reverse Isolation 8 3 4 Gain Drift Changes over Time temperature and bias The gain drift refers to the max...

Page 254: ...8 Basis of Network Measurement 8 3 Amplifier Parameter Specifications 250...

Page 255: ...sformation 8 4 Complex Impedance The complex impedance data can be observed in S11 or S22 measurement of the DUT including the phase and amplitude information such as the series resistance series reac...

Page 256: ...r 2 Set and calibrate the analyzer 3 Connector shown in Fig 8 10 for S11 or S22 measurement 4 Observe the impedance data a Select the Smith chart format b Set the scale of the displayed measurement re...

Page 257: ...8 Basis of Network Measurement 8 4 Complex Impedance 253...

Page 258: ...of the device includes the linear phase shift component and high order phase shift component 1 Linear phase shift component refer to the average transition time of the signal indicating the electrica...

Page 259: ...The group delay of Device 1 is different from that of Device 2 as it is calculated by the analyzer according to the phase ripple slope The phase ripple slope depends on the ripple quantity within the...

Page 260: ...be incorrect as shown in Fig 8 15 Insufficient sampling may occur in measurement of the device of long electrical delay Adjust the following settings until the measurement trace does not change so as...

Page 261: ...ip between the displayed absolute power dBm or W and frequency 8 6 1 What is the absolute output power The absolute output power is the power of the reception port of the analyzer This is the absolute...

Page 262: ...ings corresponding to the amplifier to be tested 6 Remove the amplifier and connect the attenuator and cable between two ports Apply the trace operation function and save the data trace into the memor...

Page 263: ...t shown by the dotted line in the actual situation This is caused by the phase shift arising from changes of the input power level 3 For the 64QAM signal only the quadrant is drawn shown in Fig 8 18 b...

Page 264: ...nnect the amplifier and provide the DC bias Fig 8 19 Connection in AM PM Transformation Measurement 6 Select the analyzer settings corresponding to the tested amplifier so as to perform gain compressi...

Page 265: ...hase data instead of the group delay data in second The phase data may be more usable for the device transmitting modulation signals b Provide a measurement method with noise lower than that of group...

Page 266: ...is applied on the output port of the amplifier 2 The response signal is measured at the input end of the amplifier 3 The equivalent S parameter is S12 8 9 2 Why to measure reverse isolation The ideal...

Page 267: ...r 8 9 4 Steps of Reverse Isolation Measurement 1 Reset the analyzer 2 Select the S12 measurement type 3 Connect the amplifier as shown in Fig 8 22 and provide the DC bias Fig 8 22 Connection in Revers...

Page 268: ...te the output power of the amplifier Too high output power may lead to the following results a The output power exceeds the input compression level of the receiver of the analyzer resulting in inaccur...

Page 269: ...ted amplifier 7 Remove and calibrate the amplifier The attenuator coupler and cable used in measurement must be included in calibration 8 Reconnect the amplifier 9 Set the scale of measurement display...

Page 270: ...LAN LocalAreaNetwork VXI 11 protocol TCPIP host_address LAN_device_name INSTR Original socket protocol TCPIP host_address port SOCKET Remote control can be realized by the connecting the instrument th...

Page 271: ...lows TCPIP hostaddress LANdevicename INSTR or TCPIP hostaddress port SOCKET Where TCPIP refers to the applied network protocol hostaddress refers to the IP address of the instrument or the host name u...

Page 272: ...ddressed by the master control computer according to the GPIB bus address and the user can set the GPIB address and ID query string The default GPIB communication language is SCPI command Refer to ANS...

Page 273: ...e SCPI command is composed of the command head and one or more parameter s which are separated by spaces The command head includes one or more key field s The command with the suffix question mark is...

Page 274: ...s and cannot be queried Generally there is no front panel key corresponding to the event command The event command is used to trigger an event at the specific time Query A special type of command For...

Page 275: ...e executed TRIGger SEQuence SCOPe ALL CURRent Where SEQuence is optional The part in the angle brackets must not be used according to the literal meaning in the command The angle brackets mean the nec...

Page 276: ...module of the instrument software is dedicated to analysis of each received SCPI command It is used to divide the command into separate command elements according to a series of rules to distinguish...

Page 277: ...pace allowed after the E in exponential 7 89E 01 use either E or e in exponential 256 leading allowed 5 digits left of decimal point optional Extended Numeric Parameters The numeric parameter is exten...

Page 278: ...ters ON boolean true OFF boolean false 1 boolean true 0 boolean false String Parameters For the character string type the ASCII character string is allowed to be transmitted as the parameter Single an...

Page 279: ...ctal format An appropriate identifier should be applied in front of the value in the binary hexadecimal or octal format The identifier is not required in the decimal format default The entered value w...

Page 280: ...ding setting and query commands If one command line includes query commands query results are unpredictable The returned value will be fixed if the following command is entered FREQ STAR 1 GHZ SPAN 10...

Page 281: ...ructure of State Register Organization Register categories are as follows 1 STB and SRE The top register of the state report system is composed of the state byte STB and associated shielding register...

Page 282: ...properly realize the functions of the state report system the controller in the test system must receive and evaluate the information of all instruments Standard methods to be applied include 1 Servi...

Page 283: ...the controller program so as to find more accurate causes The queue should be always inquired in the controller program test phase to obtain the commands sent by the controller to the instrument 9 2 P...

Page 284: ...bnet with the master controller Fig 9 6 LAN Interface Setting Attention Ensure normal physical connection of the vector network analyzer through the 10Base TLAN or 100Base TLAN cable The vector networ...

Page 285: ...as follows Press System Configuration GPIB address G to enter the interface shown in Fig 9 9 Modify the GPIB address in the Local GPIB address input box through the keyboard and mouse or number keys o...

Page 286: ...bottom VXI GPIB LAN and USB interface to facilitate direct recalling The vector network analyzer supports the following programmed interfaces GPIB LAN and RS 232 Such interfaces are used with the VIS...

Page 287: ...the instrument handle to the analyzer voidInitController ViState state state viOpenDefaultRM defaultRM state viOpen defaultRM analyzerString VI_NULL VI_NULL analyzer 9 3 2 3 Instrument Initialization...

Page 288: ...ws how to set the sweep parameters of AV3672 series vector network analyzers voidSweepSettings ViState state longretCnt selection of measurement state viWrite analyzer CALC PAR SEL CH1_WIN1_LINE1 n 50...

Page 289: ...gretCnt charrd_Buf_Data VI_READ_BUFLEN define VI_READ_BUFLEN 20 selection of measurement state viWrite analyzer CALC PAR SEL CH1_WIN1_LINE1 n 50 retCnt set the data format as logarithmic amplitude for...

Page 290: ...smoothing function and set the smoothing aperture as 20 state viWrite analyzer CALCulate1 SMOothing STATe ON n 40 retCnt state viWrite analyzer CALCulate1 SMOothing APERture 20 n 40 retCnt 9 3 4 Read...

Page 291: ...te analyzer CALC MARK X 15 retCnt state viRead analyzer rd_Buf_Marker 30 retCnt read the Y axis coordinate information state viWrite analyzer CALC MARK Y 15 retCnt state viRead analyzer rd_Buf_Marker...

Page 292: ...OPC state viWrite analyzer ABOR INIT IMM OPC 20 retCnt state viRead analyzer OpcOk 2 retCnt Wait for OPC and return to 1 Method 3 of waiting for stop of sweep use OPC To enable GPIB service request s...

Page 293: ...am of the instrument driver 2 Interactive developer interface To facilitate use the graphical interactive developer interface is generally set in the application environment supporting instrument driv...

Page 294: ...ance with the instrument categories defined in the IVI specifications The application development environments are the same including Visual Studio Visual Basic Agilent VEE LabVIEW CVI LabWindows etc...

Page 295: ...iod we will implement free repair according to the commitments in the warranty otherwise we will charge the costs Operating principle 291 Fault diagnosis and troubleshooting 292 Error information 294...

Page 296: ...nd the generated intermediate frequency signals are transmitted to the intermediate frequency signal conditioning module for further processing The intermediate frequency signals are conditioned by th...

Page 297: ...the menu bar to open the Custom user state window Remove the tick in the check box in front of Save final state as user reset state and Enable user reset state Click OK to close the Custom user state...

Page 298: ...er in operation indicates operation or hardware problems All prompt warning and error events in operation are recorded in the error log of the vector network analyzer Using the error log the user can...

Page 299: ...rement such as failure caused by data loss or improper setting Blue Warning Irregular operation in measurement such as failure of measurement as a result of mismatch of the instrument setting and disp...

Page 300: ...e all standard measurements for calibration 515 Prompt The correction function cannot be enabled no error correction data corresponding to Channel x or Measurement x Perform calibration No error corre...

Page 301: ...er 530 Prompt Execution error the data dimensions do not match 531 Prompt Execution error the array cleared 532 Prompt Execution error the array function is invalid 533 Prompt Execution error the arra...

Page 302: ...rompt Setting conflict the network analyzer cannot be initialized wrong address 572 Prompt Setting conflict the print port drive program or USB driven dynamic library cannot be loaded 573 Prompt Setti...

Page 303: ...nterpolation cannot be done to the original standard calibration kit in the segment sweep mode Shut down the calibration function 601 Error Calibration is not complete the standard calibration kit mea...

Page 304: ...e The calibration set file is a collection of calibration sets and saved in the hard disc 635 Error Calibration set file x saving failure File operation error and saving suspension 636 Prompt One cali...

Page 305: ...bration fails The internal auto calibration tuning of the YIG oscillator fails 861 Error The simulation slope calibration fails The internal simulation slope calibration fails 865 Error EEPROM writing...

Page 306: ...1103 Prompt The measurement name is repeated 1104 Error The number of measurements is out of limit At most 512 measurements can be created 1105 Error The parameter is invalid The measurement paramete...

Page 307: ...ta for measurement cannot be provided 1128 Prompt Time domain transformation or Add gate operation are not allowed in the selected sweep type or prohibited 1284 Prompt The instrument state word is cha...

Page 308: ...ost for each window The trace x cannot be created At most 8 traces can be set for each window Refer to the relevant help information of trace channel and window setting 1620 Error No trace is found 16...

Page 309: ...ber is larger than the allowable number in the logarithmic sweep mode The maximum number of sweep points should be 401 in the logarithmic sweep mode 2048 Error Options should be added based on the sta...

Page 310: ...nterface should be in the CIC mode according to the function requirements 2080 Error ENOL no listener for GPIB 2081 Error EADR GPIB interface address is not correct 2082 Error EARG the parameter is in...

Page 311: ...re running Only one program can be applied This is generally caused by operation of the installed program especially CPU board upgrading 2155 Error Power supply service x 2156 Error GPIB drive cannot...

Page 312: ...ce the instrument into the outer packing box 4 Seal the opening of the packing box with a tape and strengthen the packing box with nylon straps 4 Mark Fragile No touch and Handle with care on the box...

Page 313: ...hould be 23 3 C and the ambient temperature change must not exceed 1 C after calibration The pressure should be the atmospheric pressure Attention Different models and options AV3672A B C D E are resp...

Page 314: ...6dBm 4dBm 5dBm 20GHz f 26 5GHz 4dBm 2dBm 2dBm 0dBm Table 11 2 2 Maximum Output Power Indicator of AV3672C D Test Port continued Frequency range Standard Option 400 Options 201 401 402 Maximum output...

Page 315: ...5GHz 3dB 13 5GHz f 40GHz 4dB 40GHz f 50GHz 4 5dB 50GHz f 67GHz 11 1 7Sweep Range of Port Output Power Table 11 3 Indicators of AV3672 Power Sweep Range Frequency range Power Sweep Range AV3672A B AV36...

Page 316: ...MHz 0 050dB 0 200 0 050dB 0 900 0 050dB 0 900 50MHz f 500MHz 0 007dB 0 051 0 020dB 0 700 0 020dB 0 700 500MHz f 13 5GHz 0 002dB 0 042 0 005dB 0 040 0 005dB 0 040 13 5GHz f 20GHz 0 003dB 0 054 0 004dB...

Page 317: ...load matching 48dB 44dB Table 11 6 2 Indicators of Transmission Tracking Reflection Tracking Effective Source Matching Effective Direction and Effective Load Matching of AV3672C D continued Power set...

Page 318: ...twork analyzers can be set between 1 and 32001 11 1 15 Measurement Display Format AV3672 series vector network analyzers have the following measurement display options logarithmic amplitude linear amp...

Page 319: ...set the enabling of sweep involving multiple segments The power level intermediate frequency bandwidth and sweep time of each segment can be defined separately 11 1 20 Intermediate Frequency Bandwidt...

Page 320: ...tracking reflection tracking effective source matching effective direction and effective load matching 323 11 2 1 Test of Frequency Accuracy 11 2 1 1 Items of Frequency Accuracy Test Test the frequen...

Page 321: ...ssion Test the harmonic suppression indicators of frequency sweep signals output by the port of AV3672 series vector network analyzers 11 2 3 2 Instrument and Accessories for Test of Port Output Harmo...

Page 322: ...rements Fig 11 3 Block Diagram of Test of Harmonic Non harmonic Suppression Test 11 2 4 Test of Maximum Output Power of Port 11 2 4 1 Items of Test of Maximum Output Power of Port Test the maximum out...

Page 323: ...and the setting power Choose the larger absolute value out of the differences as the power accuracy result and input it Change the start and stop frequencirs and record measurement results 5 Connect t...

Page 324: ...easurement and Receiver Select B and Port 1 under Source port and click OK Fig 11 5 Output Power Linearity of Test Port 3 Press Channel More Hardware setting Graphical configuration Select Low band hi...

Page 325: ...21 phase trace noise 10 Click Meas S21 11 Record the deviation displayed on the screen after sweep of the vector network analyzer Measurement of S21 amplitude trace noise 12 Click Response Format Loga...

Page 326: ...averaging in the pop up dialog box Set the average factor as 8 and continue calibration 11 After all calibrations click OK Then click Response Avg Average Factor and enter 8 to enable the averaging f...

Page 327: ...Direction etc 11 2 10 1 Items of Test of Transmission Tracking Reflection Tracking Effective Source Matching Effective Direction and Effective Load Matching Test the indicators of transmission tracki...

Page 328: ...ctively connect the open circuit device short circuit device and load to two ports Select Open circuit device Short circuit device and Load and start calibration 8 After calibration connect the system...

Page 329: ...Port 1 11 Click Analysis Memory Trace Operation Data memory 12 Connect the open circuit device to the test cable end face of the test port 1 Click Scale Reference value and enter 50 13 Change the sta...

Page 330: ...User Range Search the maximum value within the range The maximum value is the effective load matching value of Port 4 Test of reflection tracking of Port 3 32 Connect the short circuit device to the...

Page 331: ...43 Change the start and stop value of User Range Search the maximum value within the set range The effective source matching value of the test port 4 is the difference of the obtained marker value min...

Page 332: ...trument In order to help you rapidly get familiar with the measurement process the measurement attenuator is taken as an example below to introduce the process and relevant settings for measurement of...

Page 333: ...ed 10dBm measurement will not be affected by power level changes 1 3 Selection of Measurement Parameter and Creating of New Trace For more details refer to 4 2 Selection of Measurement Parameter Right...

Page 334: ...trace If Create in New Window is ticked a new trace will be created in a new window 1 4 Calibration For more details refer to 7 Calibration Press Cal on the front panel and click Cal in the auxiliary...

Page 335: ...asure Automatically skip to next step after calibration Finish step1 7 Click Done after all calibration steps have been finished 1 5 Connection of DUT 1 6 Scale Adjustment and Data and Analysis For mo...

Page 336: ...marker Rotate the knob and adjust the frequency corresponding to the marker The marker reading is displayed in the upper right corner of the screen 1 7 Recording or Saving of Data For more details ref...

Page 337: ...rocessed with other programs 2 The data file can be exported and printed or edited and processed with other kinds of software but cannot be recalled 3 The graphical file can be exported and printed bu...

Page 338: ...the cable mismatches obviously In the time domain the gate function can be used to filter undesired response followed by transformation of time domain data into frequency range data This function can...

Page 339: ...dix Appendix 2 Time Domain Measurement 335 2 Perform ratio operation 3 Perform calibration error correction 4 Transform the frequency domain data into the time domain data 5 Display the measurement re...

Page 340: ...of the analyzer refers to the capability to distinguish two adjacent responses For the responses of the same amplitude it is equal to the pulse width of the impact response defined at the 50 6dB ampli...

Page 341: ...w will be used to improve the resolution of measurement otherwise the maximum window will be used to improve the dynamic range of measurement Prompt Calculate the pulse width in time domain transforma...

Page 342: ...hin different time spans 1 The resolution of 50ps can be obtained within the time span of 10ns 2 The resolution of 12 5ps can be obtained within the time span of 2 5ns Fig 2 5 Display Resolution Promp...

Page 343: ...can be modified 1 Increase the number of sweep points 2 Reduce the frequency span Attention All the above modifications must be done before calibration The measurement range in m can be calculated by...

Page 344: ...analyzer to distinguish two adjacent response signals The pulse width is inversely proportional to the frequency span of measurement The frequency span should be increased to reduce the pulse width 2...

Page 345: ...associated with the selected window in the time domain measurement and the response resolution is associated with the frequency span and the selected window Schedule 2 1 shows the window characterist...

Page 346: ...e DUT will be calculated by the analyzer 3 Select the gate shape a Band pass set the gate at the center of the response to be reserved and open the gate function The response beyond the gate will be r...

Page 347: ...ale is 0 5dB grid It can be seen in Fig 2 11 that the smallest gate has the largest ripple Fig 2 11 Passband Ripple of Various Gate Filters 2 4 3 3 Side Lobe Level As shown in Fig 2 12 four kinds of f...

Page 348: ...difference of the stop time minus start time 2 T2 is the time between the passband edge and the point of 6dB indicating the filter cutoff rate 3 T3 is the time between the point of 6dB and gate resist...

Page 349: ...first response which will occur but cannot be predicted 2 5 1 2 Masking arising from Energy Reflection Masking arising from reflection will occur in case of any major error configuration As shown in F...

Page 350: ...to the test port 2 5 2 2 Data on Vertical Axis 1 Refer to the return loss dB in the LOGMAG mode 2 Refer to the reflection coefficient in the LINMAG mode Fig 2 16 shows an example of reflection measure...

Page 351: ...o output However such paths are all longer than the shortest path Fig 2 17 Transmission Measurement in Band pass Mode Prompt Observation of the main path of SAW filter response In order to see the mai...

Page 352: ...rom the test port to breaking point and then back to the test port Note Enter the appropriate velocity factor to confirm the actual physical length 2 5 5 2 Data on Vertical Axis Refer to the reflectio...

Page 353: ...B in the LOGMAG mode only for the pulse The following figure shows the low pass step response of the amplifier 1 The average group delay within the whole measurement frequency range varies with the ti...

Page 354: ...an be simulated 3 The frequency with a relationship to the case of 0Hz should be measured The first new data point should be calculated in the frequency range 4 It can be applied in the cases includin...

Page 355: ...determined according to the frequency span in the frequency range measurement 2 Low pass step voltage waveform from 0 to maximum The step rising time is determined according to the maximum frequency i...

Page 356: ...surement frequency range will be displayed 2 6 5 4 Format for the low pass mode REAL 1 The real unit response will be displayed in this format 2 The low pass mode should be applied if the DUT has the...

Page 357: ...Enable the time domain transformation and gate functions and close the Transform dialog box Change the boundary settings of the time domain gate by dragging the mouse The start and stop value of the...

Page 358: ...easurement in the low pass time domain mode you must select the low pass measurement mode in the Transform dialog box or set the start frequency of measurement by clicking the Set frequency low pass I...

Page 359: ...timulus Freq Freq Offset on the screen Fig 3 1 Opening of Measurement Setting Dialog Box 2 After the above operations the following setting dialog box will pop up The stimulus and response in frequenc...

Page 360: ...quency sweep mode The coupling logarithmic frequency sweep mode can be applied in the following two cases 1 Frequency offset 0 multiplier 1 and divisor 1 2 Multiplier 0 X axis display select the X axi...

Page 361: ...frequency offset Divisor set the divisor value between 1 and 1 000 3 2 2 Setting of Non coupling Mode Fig 3 4 Non coupling setting Dialog Box Various setting windows are set for different sweep types...

Page 362: ...end and the mixer output port The ports can be matched effectively by adding one attenuator between ports so as to increase the attenuation value to be more than twice The larger the attenuation valu...

Page 363: ...l meaning of frequency transformation loss i e the ratio of the output signal power and input signal power This ratio remains constant within a certain input power range When the input signal power in...

Page 364: ...ce 50 75 For example if the output power of the mixer is connected to the filter the filter can be used as the terminal in isolation measurement Fig 3 8 LO RF Isolation Test Fig 3 9 LO IF Isolation Te...

Page 365: ...tain the harmonic output As the harmonic unit is dBc the difference between RF signals and harmonics should be calculated Calibrate the source and receiver within the whole frequency range before meas...

Page 366: ...Appendix Appendix 3 Frequency Offset Measurement 362 Fig 3 13 Test of Return Loss of Mixer LO Port...

Page 367: ...Domain Waveform If required the AV3672 series vector network analyzer can be set into the pulse mode In the pulse mode the continuous wave is output after pulse modulation The time domain waveform is...

Page 368: ...e if Calculate is pressed the duty cycle of the source and each reception channel will be automatically calculated and displayed a Pulse Mode ON OFF if this option is selected the pulse function will...

Page 369: ...ingly 2 Measurement parameters a CW frequency set the CW frequency b Source select the output source For the double port analyzer Port 1 is used to output the pulse modulation signal For the four port...

Page 370: ...utton to start calculation according to the parameter settings and display the pulse envelope waveform Pulse Envelope Measurement will appear in the calculation process 4 4 Wideband Pulse Measurement...

Page 371: ...F and the source outputs continuous waves 6 Pulse repetition interval width and delay set the width delay and interval of the pulse generator The sum of the delay and width of the pulse signal must be...

Page 372: ...set the instrument in the internal modulator protection state 5 Use of internal pulse generator properly set the available items in this dialog box 6 Use of internal gate select it to set the instrum...

Page 373: ...Appendix Appendix 4 Pulse Measurement 369 Fig 4 9 Receiver gain configuration Dialog Box...

Page 374: ...input power increases the amplifier gain will decrease and the amplifier will work in the compression zone 4 The 1dB compression point is commonly used in the amplifier compression measurement It is d...

Page 375: ...st to the target gain All compression parameter data are measured at this point including the input power output power and gain of the compression point 5 2 2 Parameter Curve of Gain Compression In th...

Page 376: ...er display the compression point as shown in the following figure Fig 5 2 Schematic Diagram of Calculation of Compression in Saturated State The maximum output power can be found at each frequency The...

Page 377: ...n measurements Reflection parameters are measured after the full port calibration 2 The gain is calculated according to the measured frequency and power 3 The compression is found by searching after d...

Page 378: ...umption is more accurate than continuous power sweep Intelligent sweep is repeated until one of the following cases occurs 1 All the data points are within the limit range When the compression level o...

Page 379: ...arch the possible maximum gain of the amplifier 2 Compression in saturated state The external maximum gain of each frequency point will be saved to calculate the compression point In the intelligent s...

Page 380: ...of Gain Compression Measurement Menu path Response Measure Measurement Class Select Gain Compression and click OK The default setting is Channel 1 To enable the gain compression measurement in a new c...

Page 381: ...method shown as follows Schedule 5 3 Limitations of Data Point Number of Two Sweep Modes Compressio n Method Intelligent sweep reduce the number of frequency points to ensure that the total number of...

Page 382: ...t port compression may be done by the receiver of the vector network analyzer However with the receiver attenuation low input power may affect the accuracy of power measurement and result in high nois...

Page 383: ...ession point will be used to determine the compression value in amplifier gain compression which will lead to inaccurate results In the linear gain compression the reference gain is measured at the li...

Page 384: ...ment of the nonlinear gain amplifier In intelligent sweep the maximum power is updated in each repetition In order to increase the possibility to measure the actual maximum value of the amplifier low...

Page 385: ...wer calibration still fails after exceeding maximum reading times sweep will not be repeated and next step will be started directly Power meter configuration select the power meter model if the USB po...

Page 386: ...plifier and provide the DC deviation Fig 5 11 Connection of Gain Compression Measurement 5 3 6 Adding of Track To obtain more measurement parameters new traces should be added Click Trace New Trace Ti...

Page 387: ...combination of SOLT calibration and interchangeable mixer filter in calibration Complete setting and calibration procedures Easy converter measurement after calibration Measurement Support forward and...

Page 388: ...y identified by the analyzer The DUT can be connected to any port of the instrument For the four port vector network analyzer the internal source 2 can be used as the LO input end so no external sourc...

Page 389: ...sweep from one frequency point to next frequency point The phase measurement of the first point is random in each sweep However the initial phase deviation has no influence on measurement of the grou...

Page 390: ...end of DUT must be connected to Port 1 of the test instrument Power Level Set the level of the input and output port of DUT Source Attenuator If Automatic is selected the test instrument can select th...

Page 391: ...guration dialog box will pop up Set the configuration of the signal path to each port in the channel Fig 6 5 Path configuration Dialog Box 3 Mixer Frequency dialog box Click Mixer Frequency and the fo...

Page 392: ...en the LO and output frequency are set click Calc IN to automatically calculate the input frequency Calc OUT When the LO and input frequency are set click Calc OUT to automatically calculate the outpu...

Page 393: ...ctual measurement requirements The default mode is Internal c LO2 The default setting is uncontrolled Set the LO 2 port in the Mixer setting dialog box The corresponding port will be displayed LO2 pow...

Page 394: ...xer and the following dialog box will appear Fig 6 9 Mixer setting Dialog Box Converter Stages click the drop down box and select the orders of the converter The default mode is 1 order If the 2 order...

Page 395: ...ge in the Frequency setting box will change accordingly With the fraction multiplier the receiver frequency can be tuned to the harmonics of the mixer 6 3 Calibration of Scalar Mixer Measurement Perfo...

Page 396: ...following figure will appear 3 Modification of through type calibration Fig 6 13 Modification of Through Type Connection a Through type calibration including Zero length through type calibration Cust...

Page 397: ...f additional elements are added between the test port and calibration reference plane the power level of the power sensor can be adjusted properly to be slightly higher than 0dBm 5 Calibration steps P...

Page 398: ...icating the input port stimulus and response A R1 S22 Matching output indicating the output port stimulus and response B R2 SC21 Frequency transformation loss indicating the input port stimulus and ou...

Page 399: ...ect the reference mixer which can be used in various settings For example the broad band mixer should be used instead of the narrow band mixer One low pass filter is connected to the output end of the...

Page 400: ...asurement Class b Select Vector mixer measurement and click Delete current measurement Then click New Channel to establish the measurement in a new channel c Set one VC21 measurement The completion pr...

Page 401: ...mixer filter Save the S2P file after calibration If the same stimulus settings are applied data can be recalled for vector mixer measurement calibration 3 Connect the reference mixer to Port 1 and bet...

Page 402: ...on type of DUT Fig 6 23 Connection Type and Calibration of DUT Select the specific connection type and calibration kit type of the DUT for each port Mixer Output connected to the filter output end of...

Page 403: ...endent internal source or external source must be used as LO of the reference mixer At the same time LO is controlled by the instrument The measurement velocity is higher if the internal source 2 is u...

Page 404: ...trument Use the 10MHz reference frequency to lock the instrument b Calibration precautions The LO source is commonly used by the reference mixer and calibration mixer in the calibration process One po...

Page 405: ...be displayed in the Search state box Set search conditions the ratio of the sweep time to the LO frequency measurement accuracy depends on the set conditions You can see that the accuracy will be redu...

Page 406: ...t is assumed in the following procedures that the stimulus source is applied to the mixer input port for SC11 and sc21 measurement and mixer output port for SC22 and SC12 measurement 1 Determine the g...

Page 407: ...nding to the 10dB gain decrease Therefore one deviation power value is added in the middle of the amplifier gain bandwidth If possible set one attenuator to keep ALC probably in the middle of the freq...

Page 408: ...re m and n are natural numbers and m n is the orders of intermodulation distortion The odd order products such as 3 order 5 order etc are close to the frequency of double tone input signals and have p...

Page 409: ...annot be measured in this case 7 2 1 2 Sound Gain Parameter The sound gain in dB refers to the tone power ratio of the output end and input end As sound signals appear in pairs the low order high orde...

Page 410: ...d of the DUT i e input intersection point IIP and output intersection point OIP Measurement orders can be set in intersection point measurement 2 3 5 7 and 9 The sound positions include high order low...

Page 411: ...CSO beat is defined as the modulation beat of the target channel signal arising from the second order beat of the DUT as a result of nonlinear characteristics It refers to the ratio of the signal leve...

Page 412: ...of the three order intermodulation sound should be measured in the three order intermodulation parameter measurement 7 2 2 1 Stimulus Setting Limitation and Out of range Intermodulation Sound Two doub...

Page 413: ...ear and list frequency sweep double tone center frequency mode voice span sweep mode power sweep mode and CW fixed double tone frequency mode The network analyzer is configured with the high power hig...

Page 414: ...sted to measure all the tone power values Linear sweepDeltaF sound span The center frequency and power of the double tone signal are fixed The frequency difference sound span of the double tone signal...

Page 415: ...intermediate frequency bandwidth smaller than the set value in the interface will be applied in measurement of the frequency below 748MHz 2 Power table Fig 7 6 Intermodulation distortion power setting...

Page 416: ...r is not selected the f2 power of the input or output signal of the DUT can be set within the range from 25dBm to 20dBm Start power stop power f1 step power and f2 step power after the sweep type is s...

Page 417: ...ed High order measure and display intermodulation signal with the frequency higher than the main sound frequency Low order measure and display intermodulation signal with the frequency lower than the...

Page 418: ...ct Port 1 and 2 and correct Receiver B by means of calibration Attention If the main sound signals frequency changes calibration may fail Changes of the main sound signal frequency may result in failu...

Page 419: ...e intermodulation spectrum measurement which can be done with frequency sweep intermodulation spectrum measurement at the same time As the two measurements are greatly different from each other interm...

Page 420: ...an be set to work only in the intermodulation spectrum channel Setting items includes the intermodulation products of different orders depending on the frequency range and center frequency and bandwid...

Page 421: ...he network analyzer Input observe the input signal Receiver R1 of the DUT This function is used to measure the frequency of intermodulation products so as to determine the power of the false signal of...

Page 422: ...ettings coupled with the stimulus f1 and f2 are set within the frequency range of the receiver Center frequency f1 f2 2 and span 4 f2 f1 N order spectrum in order to facilitation the observation of th...

Page 423: ...of Spectrum Setting Tracking bar Fig 7 14 Track Bar of Spectrum Setting This dialog box is applied to the cases with the intermodulation distortion measurement channel i e coexistence of two channels...

Page 424: ...order and seven order intermodulation products 2 Step Mode refer to the mode for intermodulation distortion channel tracking of the digital intermodulation spectrum measurement when the tracking func...

Reviews: