


7-12
IM 704210-01E
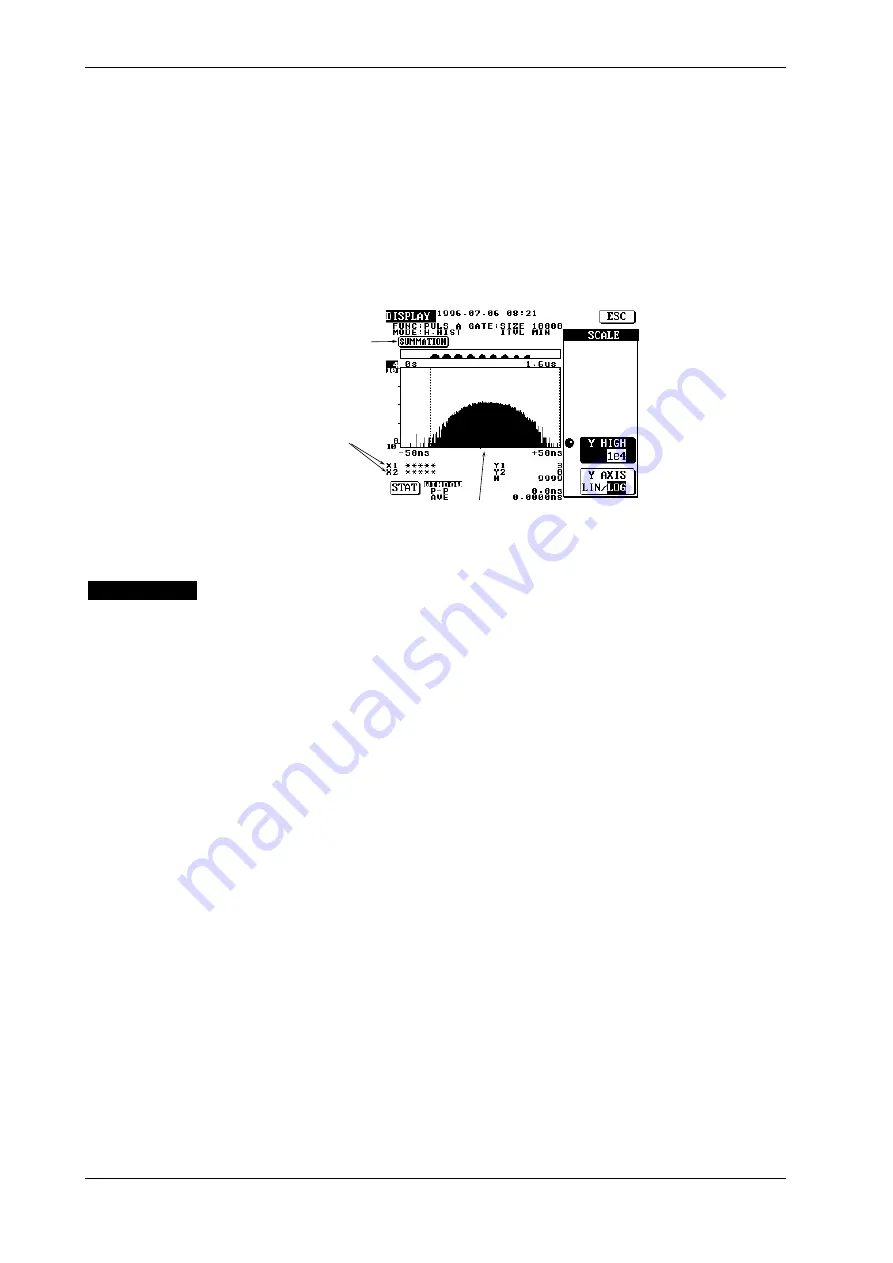
Setting the Y-axis
5.
Press the SCALE touch key to display the Y-axis menu.
• Selecting the Y-axis scale
6.
Press the Y AXIS touch key to highlight LIN or LOG. The highlighted scale will be
selected.
• Selecting the maximum value of Y-axis
7.
Press the Y HIGH touch key to highlight Y HIGH.
8.
Turn the rotary knob to select the desired maximum value of Y-axis.
X-axis coordinate of
each marker
Selects the maximum
value of Y-axis.
Selects the Y-axis scale.
Histogram data addition
(Asterisks “*” are displayed
instead of the X-axis coordinates
in the case of histogram data
addition.)
Center value of X-axis
(No numerical value is displayed
in the case of histogram data addition.)
Y-axis menu
Explanation
The histogram data addition is available only when the multi-window function is ON and AUTO
is selected as the multi-window mode.
Histogram data addition
• The frequency of all the windows (i.e. windows set using the SIZE touch key during multi-
window setting) is added.
• The frequency of the bin located within the span of X-axis and at the relatively same position to
the center value of X-axis is added.
• The center value and marker’s X-axis coordinate are not displayed since they exist for each
window, thus displaying them is meaningless.
• Y1 and Y2 (frequency of each marker) indicates the frequency obtained after addition is carried
out.
• N indicates the number of samples obtained after addition is carried out. Whether N indicates
the number of samples present in the entire window or within the area enclosed by the markers
is determined by the calculation area set in 7.1.
Setting the Y-axis
Refer to “Explanation” given in 7.1.
7.4 Carrying out Histogram Data Addition


