1-12
IM 704210-01E
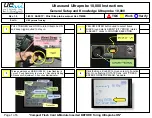
1.6 Displaying the Measured/Computed Data
Histogram Display
≡
For operating procedure, refer to 7.1
≡
A histogram of measured data is displayed for each measurement block to allow the user to
observe data distribution. Although period, phase difference or duty ratio can be set for the
X-axis and frequency for the Y-axis manually, they can be set automatically using the auto
scaling function. The following items can be set manually.
• Center value of X-axis
• Span of X-axis
• Y-axis scale (linear or logarithmic scale)
• Maximum value of Y-axis
• Space between the center values of X-axis (This setting is required when you are using the
multi-window function in hardware histogram mode.) For a description of the multi-window
function, refer to “Multi-window” on this page.
Histogram displayed when time stamp mode is selected or when hardware
histogram mode is selected and only one window is used (i.e. multi-window function
is OFF)
A histogram is displayed according to the settings made for the above items.
If a class has a time span, for instance, if the minimum and maximum values in the class are
505 ns and 515 ns, respectively, 510 ns will be treated as the class value, and samples in this class
are all considered as 510 ns. If the measured values in this class are all the same, they will be
treated as the class value. Each value given along the X-axis as shown below indicates either the
class value or displacement. A histogram is created as the number of samples in each class are
accumulated.
Class
Center value of X-axis
(Class value of
the center class)
Left-end value of X-axis
(negative displacement from
the center value of X-axis)
Maximum value of Y-axis
X-axis (time)
Y-axis
(frequency)
Each bar is called a bin.
Y-axis scale (logarithmic scale is used in this example)
Span of X-axis
(2 ns in this example)
Right-end value of X-axis
(positive displacement from
the center value of X-axis)
Histogram displayed when hardware histogram mode is selected and more than two
windows are used (i.e. multi-window function is ON)
Refer to “Multi-window” and “Panorama Display” given in this section.
Multi-window
≡
For operating procedure, refer to 7.2
≡
If data for a measurement block is distributed along more than two center values of X-axis, more
than two histograms will be created. Although all the histograms can be displayed within one
window, it is possible to set more than two windows to allow each histogram to be displayed in its
own window. This function is called the multi-window function. Up to 16 windows can be set.
An example of a window is shown in “Panorama Display” on the following page.
Using the multi-window function in conjunction with the panorama display function enables the
user to recognize easily which histogram is currently displayed.