X - R i t e e X a c t ™ I n s t r u m e n t
36
Print Characteristics Measurement
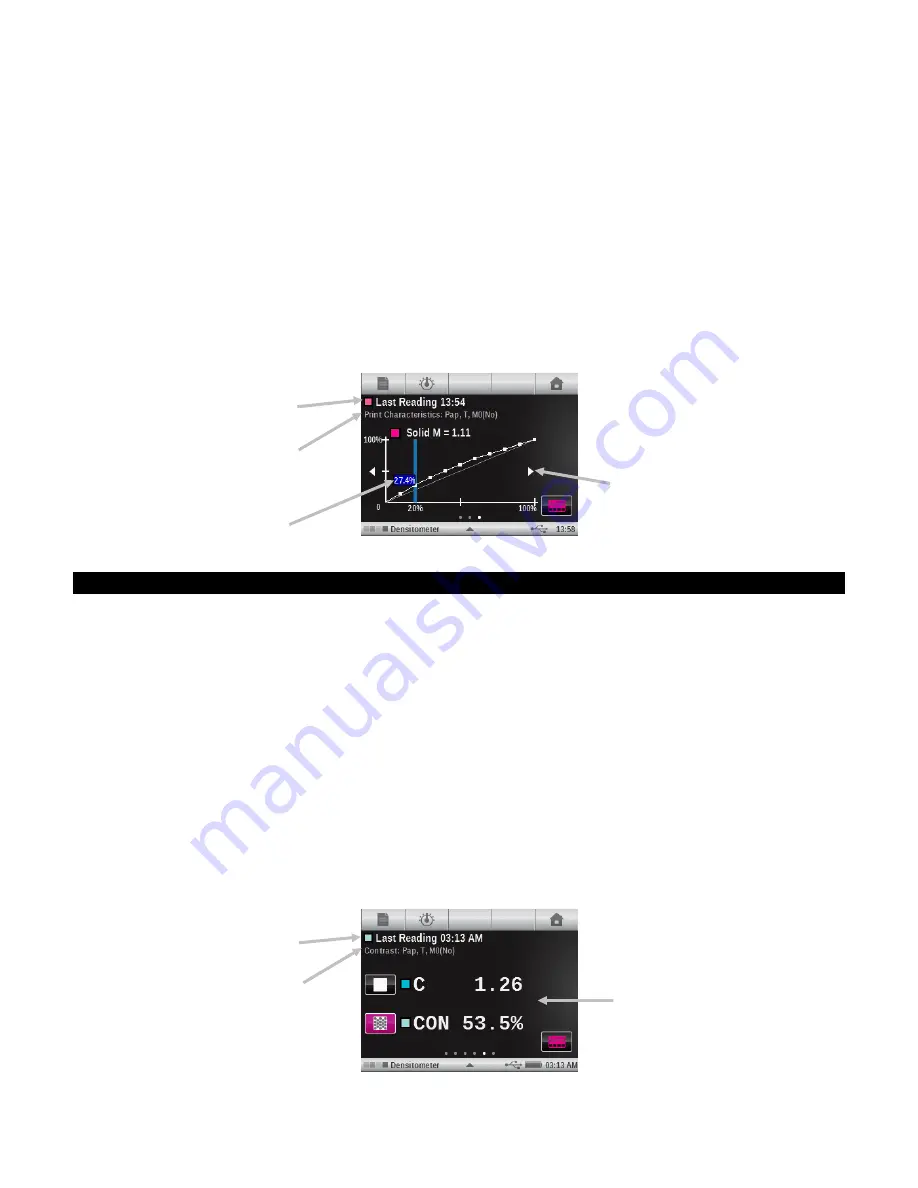
Plots a series of tone value measurements on a graph for each patch of a step wedge. The graph
ranges from 0 to 100%.
Note:
If you want to manually return to a previous measurement to view the results or to
remeasure, tap on the graph in the area of the arrows that appear on both sides of the graph.
1.
Select Print Characteristics function.
2.
Select Color option if required.
3.
Measure paper. Once paper is measured it is not required until there is a new substrate.
4.
Measure the 100% solid patch.
5.
Measure the lowest step patch in the sequence (i.e., 10%).
6.
Continue with additional step patches in an incrementing order until finished.
7.
View data by tapping the arrow icons to scan through the steps.
Contrast Function
This function is used for checking the dot quality in the shadow areas. The contrast is calculated
from the measured values of the solid ink density and the screen ink density in the shadow area.
This function allows two auto color response settings, Auto and Spot; or you can manually set the
color response to one of the process colors.
Contrast Measurement
Displays the measured values of the solid ink density and the screen ink density in the shadow area.
1.
Select Contrast function.
2.
Select Color option.
3.
Measure paper if required.
4.
Measure solid patch.
5.
Measure tint patch that corresponds to the measured solid.
6.
View data.
7.
Continue with additional tint patches that correspond to the measured solid, or touch the solid
patch on the left of the screen and measure another solid patch.
Simulated color and timestamp of
reading displayed
Function, paper, response, and
Measurement Condition selected
Percentage of reading
Touch the arrows to scan
through readings
Simulated color and timestamp of
reading displayed
Function, paper, response, and
Measurement Condition selected
Solid and contrast values


