Chapter 14, Using the Secondary Panes in Xgig TraceView
Using the Details Pane
326
Xgig Analyzer User’s Guide
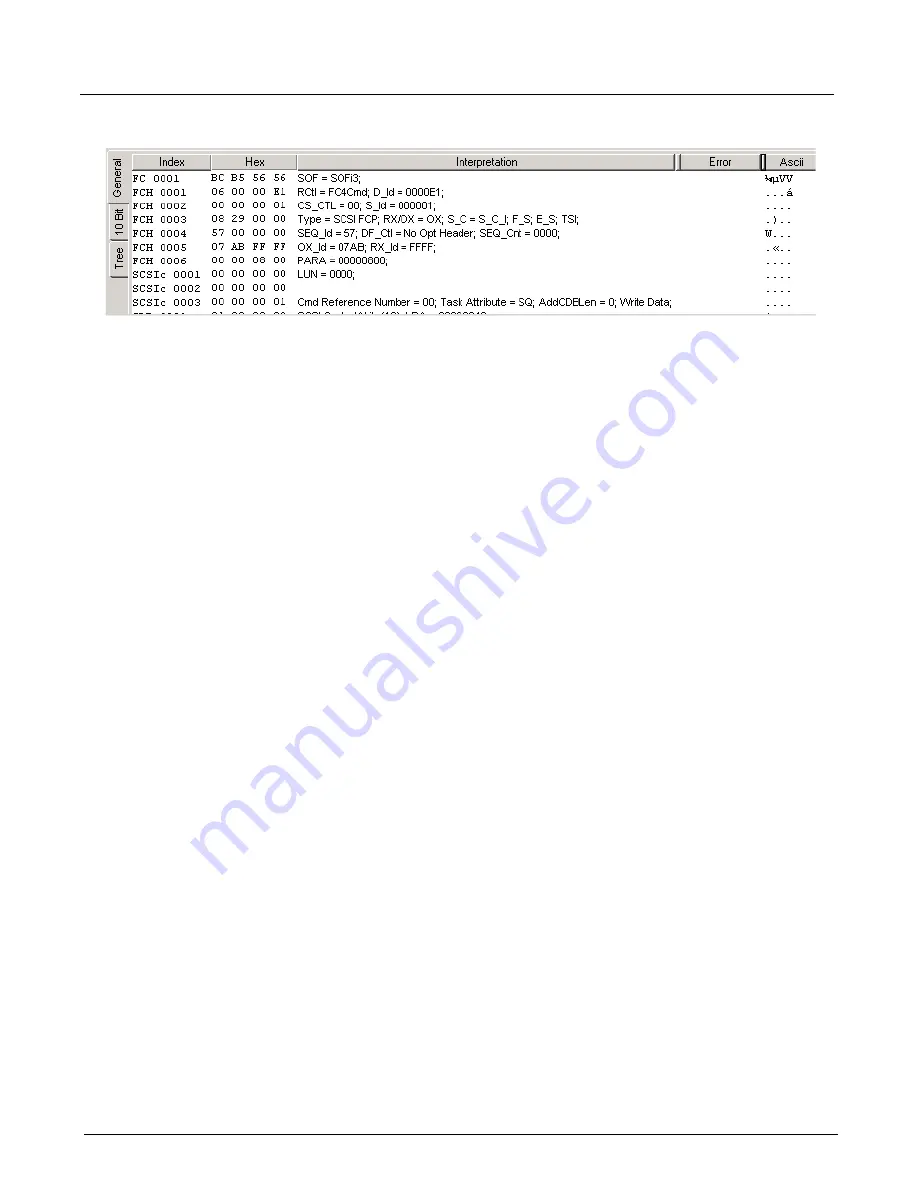
Figure 146: Inspector View, General Tab
10 Bit Tab
This tab shows the hex values for the data and a bit-by-bit display of the encoded 40G data in
10-bit increments. Errors are flagged and the K/D symbols calculated for the data are shown. The
10-Bit
tab is generally used when you are trying to debug physical equipment problems. The
10-Bit
column will be blank if the data is unavailable.
For the PCIe protocol, the
10-Bit
tab contains the hex values of the encoded data, errors, and K/D
symbols for the data for traces with PCIe events at 2.5 and 5.0 GT/s, which have 8B/10bit physical
layer encoding, respectively. The 10-bit column in this tab remains blank unless there are errors.
For the SAS/SATA protocols or for 8Gbps Fibre Channel traces, the
10-Bit
tab will contain a
column showing the scrambled form of the data. This column displays only when the original data
is in scrambled form. For 8Gbps or 4Gbps traces captured by the 8Gbps Fibre Channel blade, the
scrambled data are only generated if the descrambler is on during capture. If the
Link Speed
is set
to
8.5000 Gbps Fibre Channel
or
4.2500 Gbps FC (scrambling On)
during capture, the
scrambled data is generated and the scrambled form will display in the
10-Bit
tab.
66 Bit Tab
The Inspector 10 Bit tab has been replaced by a 66 Bit tab for all 16G FC traces, for all 10GigE
traces captured using Xgig1000 10G ports, and for all 10GigE 40G traces captured using the
Xgig1000 40G ports. The 66 Bit tab displays 66B transmission words for all 66B events.
The
66B
column displays the raw 66 bits in hexadecimal form where the first hex digit represents
the 2-bit Sync field, and the following 16 hex digits represent the following 64 bits. The
hexadecimal value captured for each 66 bit event is the user-friendly representation of these events
as shown in the protocol specifications. The value is captured after de-scrambling and
bit-swapping each field individually. Note that for Sync Error and Block Type Error 66-bit events,
each byte within the 66 bits is being bit-swapped individually.
You can change the 66bit data representation in the 66B column by selecting one of the following
menu options from the View > Data Inspector > 66 Bit Representation:
•
Display Bit-Swapped Fields (Hex)
: All the fields in the 66 bit transmission words are
bit-swapped before being presented to the user. The 66 bits are represented by 17
hexadecimal digits where the first digit represents the 2 Sync bits. This is the default
behavior.
Содержание Xgig
Страница 1: ...Xgig Analyzer Version 7 3 User s Guide ...
Страница 2: ......
Страница 3: ...Viavi Solutions 1 844 GO VIAVI www viavisolutions com Xgig Analyzer Version 7 3 User s Guide ...
Страница 6: ...Xgig Analyzer User s Guide Page iv Version 7 3 December 2015 ...
Страница 7: ...v CONTENTS ...
Страница 15: ...1 PART ONE Using Xgig Analyzer ...
Страница 16: ...PART ONE Using Xgig Analyzer 2 Xgig Analyzer User s Guide ...
Страница 27: ...13 PART TWO Using Xgig TraceControl ...
Страница 28: ...PART TWO Using Xgig TraceControl 14 Xgig Analyzer User s Guide ...
Страница 29: ...15 Chapter 2 About Xgig TraceControl In this chapter Introduction to TraceControl ...
Страница 156: ...Chapter 4 Xgig TraceControl Capture Configuration Segment Capture Options 142 Xgig Analyzer User s Guide ...
Страница 157: ...143 Chapter 5 Template Browser Template Editor In this chapter Template Browser Template Editor ...
Страница 173: ...159 Chapter 6 Xgig TraceControl Hints and Tips In this chapter TraceControl Hints and Tips Keyboard Shortcuts ...
Страница 176: ...Chapter 6 Xgig TraceControl Hints and Tips Keyboard Shortcuts 162 Xgig Analyzer User s Guide ...
Страница 177: ...163 PART THREE Using Xgig Performance Monitor ...
Страница 178: ...PART THREE Using Xgig Performance Monitor 164 Xgig Analyzer User s Guide ...
Страница 179: ...165 Chapter 7 About Xgig Performance Monitor In this chapter Introducing Xgig Performance Monitor ...
Страница 181: ...167 Chapter 8 Getting Started with Xgig Performance Monitor In this chapter Launching Xgig Performance Monitor ...
Страница 192: ...Chapter 9 Xgig Performance Monitor Port Configuration Changing Port Functions 178 Xgig Analyzer User s Guide ...
Страница 223: ...209 PART FOUR Using Xgig TraceView ...
Страница 224: ...PART FOUR Using Xgig TraceView 210 Xgig Analyzer User s Guide ...
Страница 225: ...211 Chapter 11 About Xgig TraceView In this chapter Introducing Xgig TraceView ...
Страница 227: ...213 Chapter 12 Getting Started with Xgig TraceView In this chapter Launching Xgig TraceView Working With Domains ...
Страница 379: ...365 Chapter 15 Xgig TraceView Histograms In this chapter Histogram Overview Histogram Controls ...
Страница 382: ...Chapter 15 Xgig TraceView Histograms Histogram Controls 368 Xgig Analyzer User s Guide ...
Страница 383: ...369 Chapter 16 Xgig TraceView Template Editor In this chapter Using Template Editor ...
Страница 394: ...Chapter 16 Xgig TraceView Template Editor Using Template Editor 380 Xgig Analyzer User s Guide ...
Страница 414: ...Chapter 18 Converting Files from Other Platforms Converting I Tech Files 400 Xgig Analyzer User s Guide ...
Страница 429: ...415 Chapter 20 Xgig Trace View Hints and Tips In this chapter Trace View Hints and Tips Toolbar Keyboard Shortcuts ...
Страница 437: ...423 PART FIVE Using Xgig Expert ...
Страница 438: ...PART FIVE Using Xgig Expert 424 Xgig Analyzer User s Guide ...
Страница 439: ...425 Chapter 21 Xgig Expert In this chapter Key Features of Xgig Expert Opening a Trace Switching to TraceView ...
Страница 442: ...Chapter 21 Xgig Expert 428 Xgig Analyzer User s Guide Figure 194 Xgig Expert Graph View ...
Страница 443: ...429 PART SIX Appendices ...
Страница 444: ...PART SIX Appendices 430 Xgig Analyzer User s Guide ...
Страница 454: ...Appendix C Protocol Display Color Coding 440 Xgig Analyzer User s Guide ...
Страница 461: ...447 INDEX ...
Страница 467: ......


