Filter And Hide
Chapter 13, Configuring Xgig TraceView
Xgig Analyzer User’s Guide
291
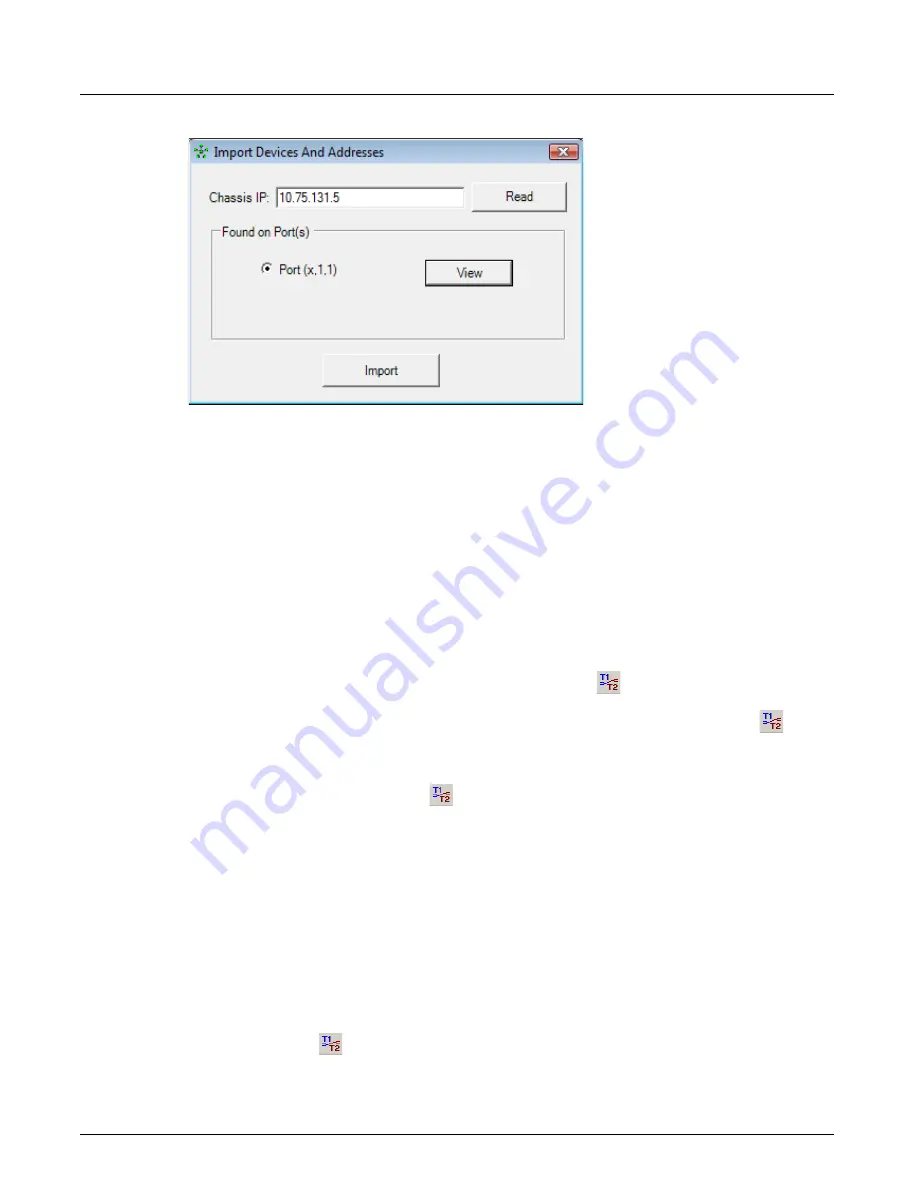
Figure 133: Import From Chassis Ports Dialog
Type the IP address of a chassis in the “Chassis IP” field, and click the
Read
button to read all the
mappings for all the port pairs on that chassis.
Click the
View
button to open the
Devices And Addresses
dialog in read-only mode, to view the
port's mappings.
When you click the
Import
button, the
Import
dialog closes, and the original dialog is filled with
the new devices and addresses, copied from the port selected.
Overlapping Data
Overlapping data is data within the trace from different sources within the same link that have
overlapping timestamps. Each link (either a wide link or a port-pair) has its own set of start and
stop timestamps with the trace. The
Show Overlapping Data
button is always active. When it
is selected TraceView shows only the overlapped data. When it is unselected, TraceView shows
the whole trace. When showing all trace data by toggling the
Show Overlapping Data
button,
you may display data that does not contain the corresponding response data from the other side of
the link. For most types of analysis, this data from only one side of the link will not be very useful.
When the
Show Overlapping Data
button is selected, TSV data, along with grid & exchange
data, is updated to correspond to current time extents. Overlapped time is calculated per link. If a
partial link is available (because a subset of ports are opened from chassis, or a single
.trc
file is
opened) only available ports are used to determine overlapped time extents.
By showing overlapping data, you are reducing the amount of data displayed for the trace.
Showing overlapping data only can narrow your view to critical sections when viewing large
traces. If you select to show overlapping data only, the yellow extent bars in the histogram will
move if this operation eliminates some of the data in the trace from the display. If you select to
show overlapping data, the yellow tickers are shown at lowest of the start times for all links and
highest of the end times for all the links. If you select to show the entire trace, the yellow tickers
are shown at the beginning and end of the trace. Ticker marker positions are not altered based on
port selection. You can select custom time extents by sliding yellow ticker markers. When
Show
Overlapping Data
button is toggled, previous custom time extents will be lost.
Содержание Xgig
Страница 1: ...Xgig Analyzer Version 7 3 User s Guide ...
Страница 2: ......
Страница 3: ...Viavi Solutions 1 844 GO VIAVI www viavisolutions com Xgig Analyzer Version 7 3 User s Guide ...
Страница 6: ...Xgig Analyzer User s Guide Page iv Version 7 3 December 2015 ...
Страница 7: ...v CONTENTS ...
Страница 15: ...1 PART ONE Using Xgig Analyzer ...
Страница 16: ...PART ONE Using Xgig Analyzer 2 Xgig Analyzer User s Guide ...
Страница 27: ...13 PART TWO Using Xgig TraceControl ...
Страница 28: ...PART TWO Using Xgig TraceControl 14 Xgig Analyzer User s Guide ...
Страница 29: ...15 Chapter 2 About Xgig TraceControl In this chapter Introduction to TraceControl ...
Страница 156: ...Chapter 4 Xgig TraceControl Capture Configuration Segment Capture Options 142 Xgig Analyzer User s Guide ...
Страница 157: ...143 Chapter 5 Template Browser Template Editor In this chapter Template Browser Template Editor ...
Страница 173: ...159 Chapter 6 Xgig TraceControl Hints and Tips In this chapter TraceControl Hints and Tips Keyboard Shortcuts ...
Страница 176: ...Chapter 6 Xgig TraceControl Hints and Tips Keyboard Shortcuts 162 Xgig Analyzer User s Guide ...
Страница 177: ...163 PART THREE Using Xgig Performance Monitor ...
Страница 178: ...PART THREE Using Xgig Performance Monitor 164 Xgig Analyzer User s Guide ...
Страница 179: ...165 Chapter 7 About Xgig Performance Monitor In this chapter Introducing Xgig Performance Monitor ...
Страница 181: ...167 Chapter 8 Getting Started with Xgig Performance Monitor In this chapter Launching Xgig Performance Monitor ...
Страница 192: ...Chapter 9 Xgig Performance Monitor Port Configuration Changing Port Functions 178 Xgig Analyzer User s Guide ...
Страница 223: ...209 PART FOUR Using Xgig TraceView ...
Страница 224: ...PART FOUR Using Xgig TraceView 210 Xgig Analyzer User s Guide ...
Страница 225: ...211 Chapter 11 About Xgig TraceView In this chapter Introducing Xgig TraceView ...
Страница 227: ...213 Chapter 12 Getting Started with Xgig TraceView In this chapter Launching Xgig TraceView Working With Domains ...
Страница 379: ...365 Chapter 15 Xgig TraceView Histograms In this chapter Histogram Overview Histogram Controls ...
Страница 382: ...Chapter 15 Xgig TraceView Histograms Histogram Controls 368 Xgig Analyzer User s Guide ...
Страница 383: ...369 Chapter 16 Xgig TraceView Template Editor In this chapter Using Template Editor ...
Страница 394: ...Chapter 16 Xgig TraceView Template Editor Using Template Editor 380 Xgig Analyzer User s Guide ...
Страница 414: ...Chapter 18 Converting Files from Other Platforms Converting I Tech Files 400 Xgig Analyzer User s Guide ...
Страница 429: ...415 Chapter 20 Xgig Trace View Hints and Tips In this chapter Trace View Hints and Tips Toolbar Keyboard Shortcuts ...
Страница 437: ...423 PART FIVE Using Xgig Expert ...
Страница 438: ...PART FIVE Using Xgig Expert 424 Xgig Analyzer User s Guide ...
Страница 439: ...425 Chapter 21 Xgig Expert In this chapter Key Features of Xgig Expert Opening a Trace Switching to TraceView ...
Страница 442: ...Chapter 21 Xgig Expert 428 Xgig Analyzer User s Guide Figure 194 Xgig Expert Graph View ...
Страница 443: ...429 PART SIX Appendices ...
Страница 444: ...PART SIX Appendices 430 Xgig Analyzer User s Guide ...
Страница 454: ...Appendix C Protocol Display Color Coding 440 Xgig Analyzer User s Guide ...
Страница 461: ...447 INDEX ...
Страница 467: ......


