Chapter 14, Using the Secondary Panes in Xgig TraceView
Using the Details Pane
328
Xgig Analyzer User’s Guide
Sync Tab
The Sync tab is shown for PCIe traces with Gen 3 PCIe events at 8.0 GT/s. This tab shows the
sync bits for ordered set events. However, the Sync tab refers you to LaneView for other Gen3
PCIe events, such as packets and non-OS events because the Inspector does not display these
events as one byte per lane per line like it displays OS events. However, LaneView displays all
events as one byte per lane per line, so it is more appropriate to look at sync bits for all events.
Tree Tab
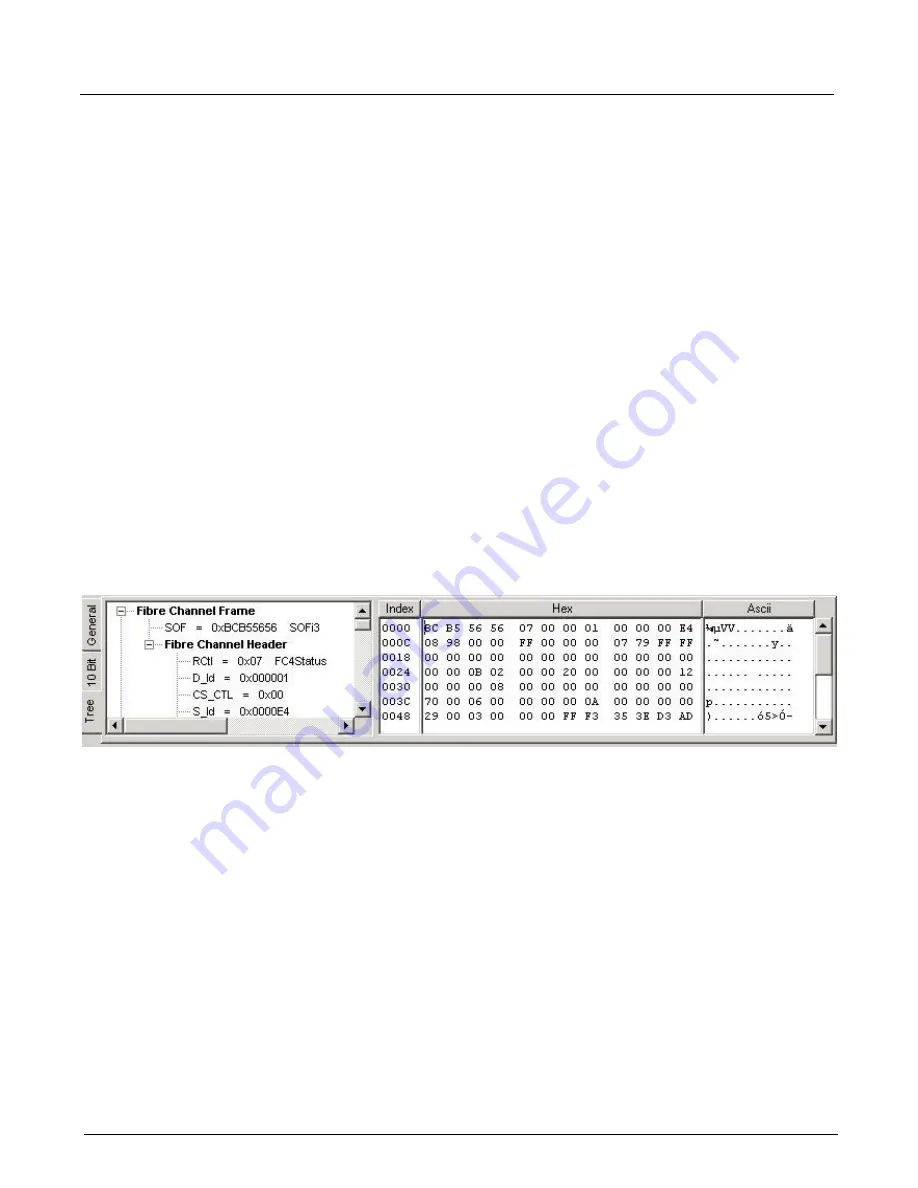
Shows the tree structure of the data when mapped to the protocol interpretation being used. You
can see the structure of the frame and values associated with all protocol elements discovered
within the frame. For example, the display of a Fibre Channel frame shows the start of frame type
derived from the SOF value, end of frame values including CRC, as well as the interpretation of
fields within the header. If you click one of the elements in the tree structure, the corresponding
hex data will highlight as well.
The Tree Tab is composed of two areas which can be resized as needed. The left portion shows the
tree view of decoded protocols for the current event. The right portion shows the hex values for the
event and their ASCII or EBCDIC representation. The hexadecimal area can be resized for a
display of anywhere between 4 and 32 bytes of data per line. Move the slider in the middle of the
pane to resize the two areas. The
Index
values change as the slider moves, showing more or less of
the hex data on each line.
Figure 147: Inspector View, Tree Tab
Creating Columns From Inspector View Fields
You can drag and drop any field from
Inspector
view to the column header row of one of the other
grids to create a column in that grid.
Context Menu Options for Inspector View
The right-click menu in TraceView is context-sensitive. The following features are available in the
tabs of Inspector view.
Copy All Columns
To copy the text from the Inspector pane into tab-separated multi-line text format, right-click in
the pane, and select
Copy All Columns
from the context menu. You can paste this into a text
editor. This option does not copy the Errors or ASCII columns. Note that the ASCII column is only
found on the General tab. This option is available for all three tabs.
Содержание Xgig
Страница 1: ...Xgig Analyzer Version 7 3 User s Guide ...
Страница 2: ......
Страница 3: ...Viavi Solutions 1 844 GO VIAVI www viavisolutions com Xgig Analyzer Version 7 3 User s Guide ...
Страница 6: ...Xgig Analyzer User s Guide Page iv Version 7 3 December 2015 ...
Страница 7: ...v CONTENTS ...
Страница 15: ...1 PART ONE Using Xgig Analyzer ...
Страница 16: ...PART ONE Using Xgig Analyzer 2 Xgig Analyzer User s Guide ...
Страница 27: ...13 PART TWO Using Xgig TraceControl ...
Страница 28: ...PART TWO Using Xgig TraceControl 14 Xgig Analyzer User s Guide ...
Страница 29: ...15 Chapter 2 About Xgig TraceControl In this chapter Introduction to TraceControl ...
Страница 156: ...Chapter 4 Xgig TraceControl Capture Configuration Segment Capture Options 142 Xgig Analyzer User s Guide ...
Страница 157: ...143 Chapter 5 Template Browser Template Editor In this chapter Template Browser Template Editor ...
Страница 173: ...159 Chapter 6 Xgig TraceControl Hints and Tips In this chapter TraceControl Hints and Tips Keyboard Shortcuts ...
Страница 176: ...Chapter 6 Xgig TraceControl Hints and Tips Keyboard Shortcuts 162 Xgig Analyzer User s Guide ...
Страница 177: ...163 PART THREE Using Xgig Performance Monitor ...
Страница 178: ...PART THREE Using Xgig Performance Monitor 164 Xgig Analyzer User s Guide ...
Страница 179: ...165 Chapter 7 About Xgig Performance Monitor In this chapter Introducing Xgig Performance Monitor ...
Страница 181: ...167 Chapter 8 Getting Started with Xgig Performance Monitor In this chapter Launching Xgig Performance Monitor ...
Страница 192: ...Chapter 9 Xgig Performance Monitor Port Configuration Changing Port Functions 178 Xgig Analyzer User s Guide ...
Страница 223: ...209 PART FOUR Using Xgig TraceView ...
Страница 224: ...PART FOUR Using Xgig TraceView 210 Xgig Analyzer User s Guide ...
Страница 225: ...211 Chapter 11 About Xgig TraceView In this chapter Introducing Xgig TraceView ...
Страница 227: ...213 Chapter 12 Getting Started with Xgig TraceView In this chapter Launching Xgig TraceView Working With Domains ...
Страница 379: ...365 Chapter 15 Xgig TraceView Histograms In this chapter Histogram Overview Histogram Controls ...
Страница 382: ...Chapter 15 Xgig TraceView Histograms Histogram Controls 368 Xgig Analyzer User s Guide ...
Страница 383: ...369 Chapter 16 Xgig TraceView Template Editor In this chapter Using Template Editor ...
Страница 394: ...Chapter 16 Xgig TraceView Template Editor Using Template Editor 380 Xgig Analyzer User s Guide ...
Страница 414: ...Chapter 18 Converting Files from Other Platforms Converting I Tech Files 400 Xgig Analyzer User s Guide ...
Страница 429: ...415 Chapter 20 Xgig Trace View Hints and Tips In this chapter Trace View Hints and Tips Toolbar Keyboard Shortcuts ...
Страница 437: ...423 PART FIVE Using Xgig Expert ...
Страница 438: ...PART FIVE Using Xgig Expert 424 Xgig Analyzer User s Guide ...
Страница 439: ...425 Chapter 21 Xgig Expert In this chapter Key Features of Xgig Expert Opening a Trace Switching to TraceView ...
Страница 442: ...Chapter 21 Xgig Expert 428 Xgig Analyzer User s Guide Figure 194 Xgig Expert Graph View ...
Страница 443: ...429 PART SIX Appendices ...
Страница 444: ...PART SIX Appendices 430 Xgig Analyzer User s Guide ...
Страница 454: ...Appendix C Protocol Display Color Coding 440 Xgig Analyzer User s Guide ...
Страница 461: ...447 INDEX ...
Страница 467: ......


