Chapter 6 Web Page Of MSC intelligent monitoring unit 73
SmartCabinet Series Solution Product for IDC or Computer Rooms User Manual
As shown in Figure 6-49, choose a device (for instance,
‘All Devices’) and the Log Type (for instance, ‘History Data’),
and set the start time and the end time (for instance, from 2018-08-06 00:00:00 to 2018-08-06 23:59:59). Then click
the
Query
button, all the history data during the time will be listed, click the
Download
button to download the query
result.
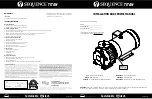
2. Historical Curve
As shown in Figure 6-50, choose a report (for instance,
‘Voltage’), and set the start time and the end time (for
instance, from 2017-08-07 00:00:00 to 2018-08-08 23:59:59). Then click the
Show Curve
button, if history data are
queried, a historical curve of the signal will be shown.
Figure 6-50 Historical curve
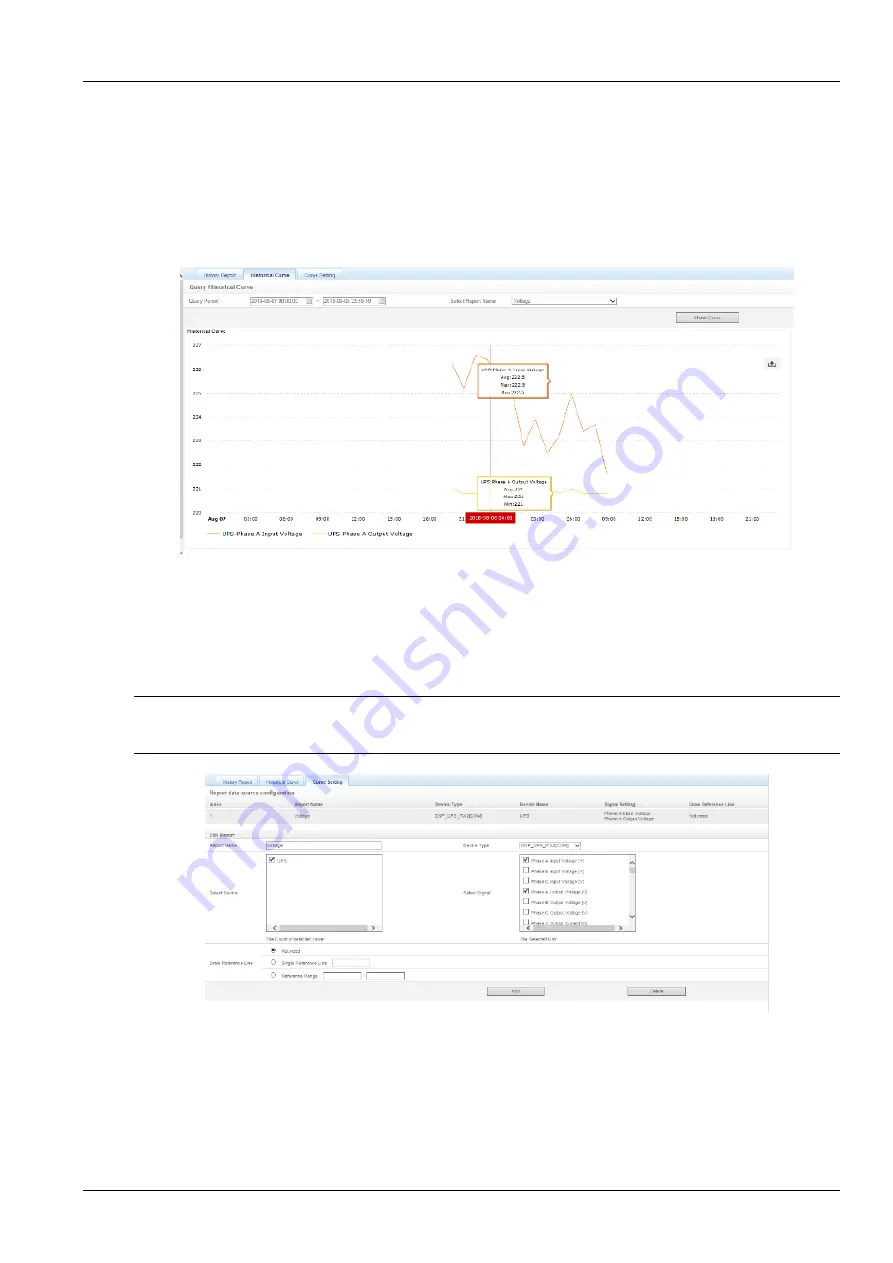
3. Curve Setting
As shown in Figure 6-51, enter report name (for
example: “Voltage”), select device type(for example:
“ENP_UPS_ITA2”), select device(for example: “UPS”), select signal(for example: “Phase A input Voltage”, ” Phase A
output Voltage
”), enter the reference curve values(for example: “Not need”), click
Add
button, and a curve report can
be added, as shown in Figure 6-51. Up to reports can be added.
Note
In the same coordinates, up to 8 curves can be displayed, that is 1 <= m*n <= 8. If more than 8 curves are needed, please export
the history data by yourself.
Figure 6-51 Curve setting
History Log
Click the
History Log
submenu under the
Data & History
menu, the page shown in Figure 6-52 pops up.