40
Modulation Monitor
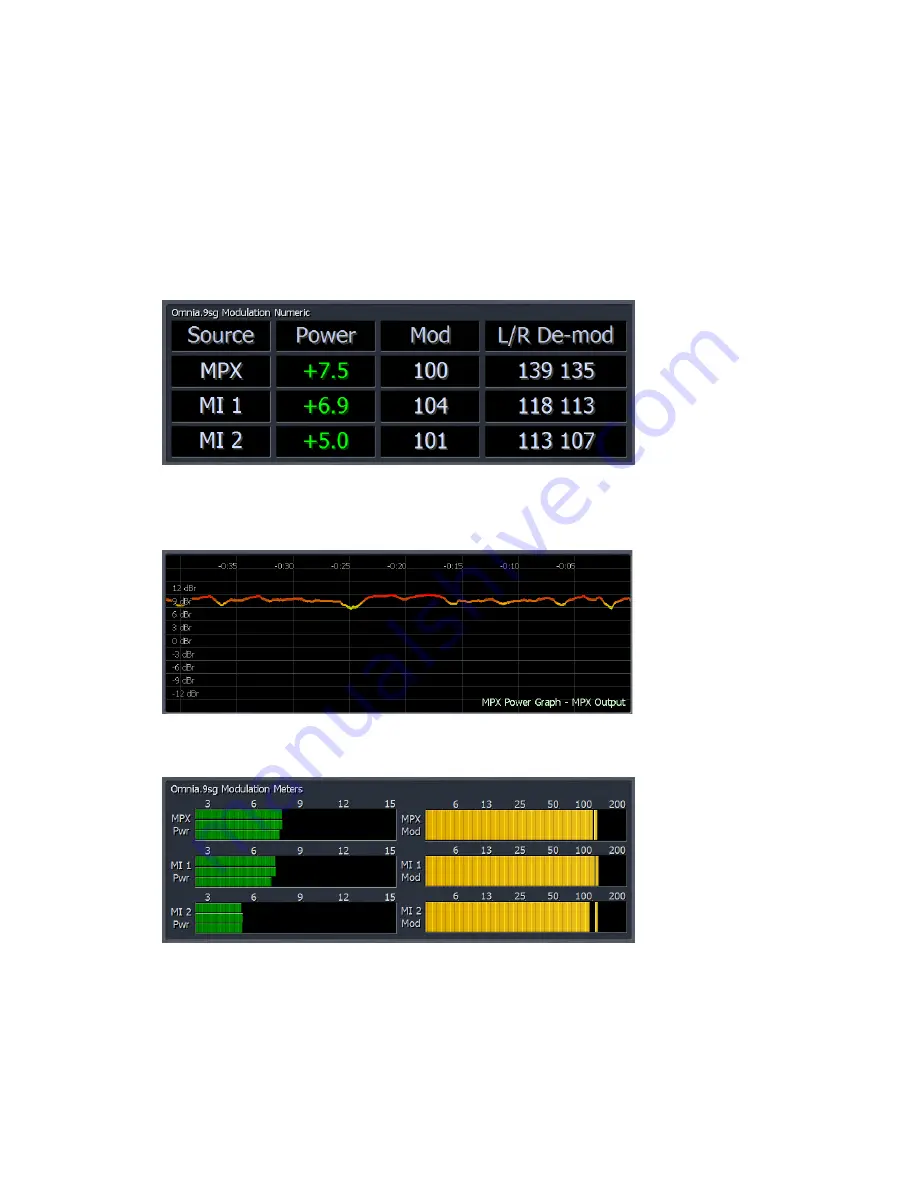
Omnia.9sg can display modulation information in a numeric form, on bar graph
meters, and, when using the MPX Power Limiter, a power graph. Exactly which
values are displayed in any of these formats is determined by the settings in the
“Meter Options” menu which are covered in greater detail in the “Meter Options”
chapter.
•
The “Numeric Modulation” display can show MPX Power, total modulation, L/R
modulation, and pilot levels as a numeric value.
•
The “MPX Power Graph” display shows loudness trends over time and operates
in much the same way as the loudness graphs described in the “Loudness
Meters” section above.
•
The “Modulation Meters” display can show all of the same information as the
“Numeric Modulation” display, but with bar graph meters.


