39
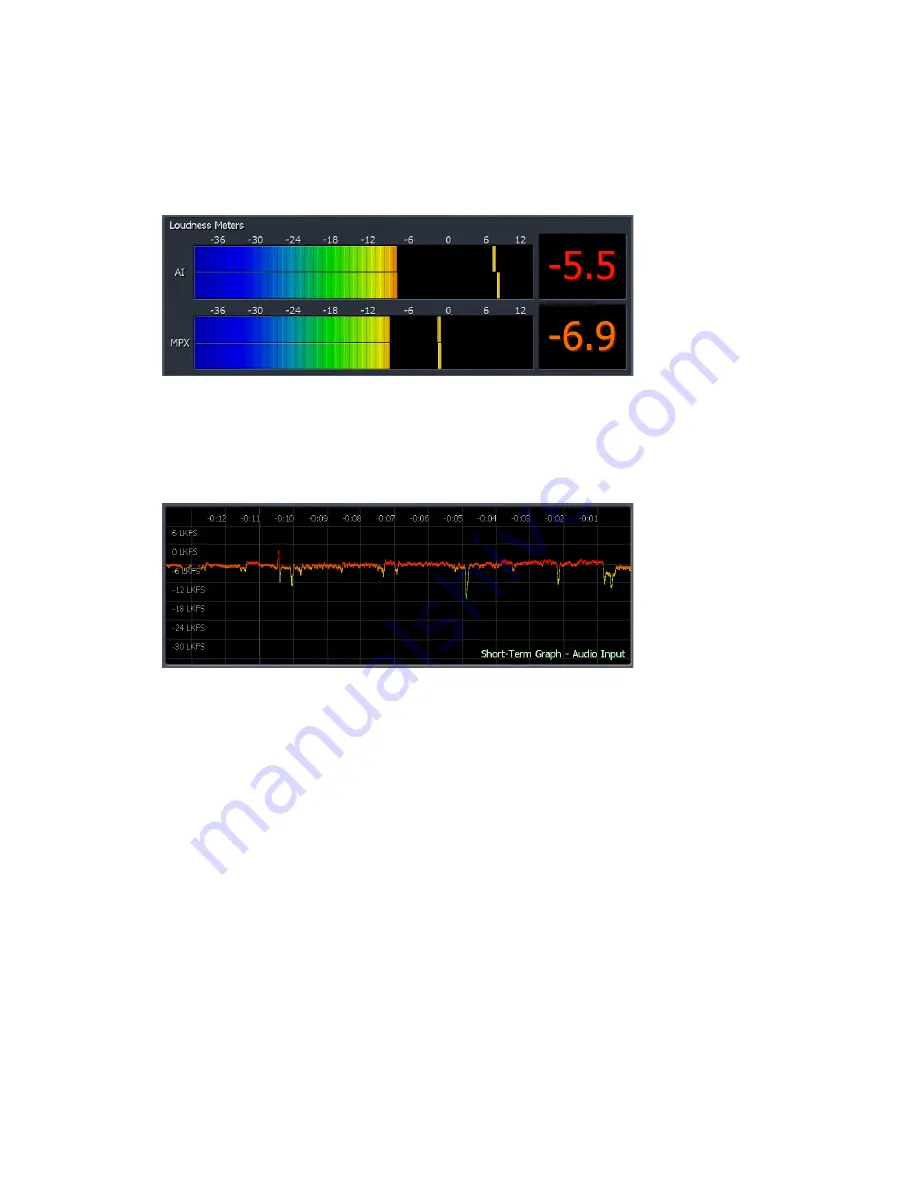
Loudness Meters
ITU-R BS.1770 loudness meters and graphs can be displayed from this menu.
•
The “Loudness Meters” display shows a bar graph and a numeric LKFS loudness
value for both the audio input levels and the MPX output.
•
The “Short Term Loudness” graph can show recent loudness measurements over
time; the exact length of time will vary depending upon display size, with longer
periods of time being available with more space. This is further adjustable by
the “X Range” control. The “History” control can be used to look at data recorded
further back in time than can be displayed in the current scrolling window.
The graph can measure input audio levels, MPX output levels, or the inputs of
either rear panel composite input.
Adjustments to the Y-axis are provided should it be necessary to shift or zoom to
better read the graph in greater detail.
The “Time” menu is set to “Relative” by default (showing the elapsed time
relative to the present) but can be changed to an actual time value if desired.
“Local” references the internal clock of Omnia.9sg. “Remote” references the
internal clock of the PC running the NfRemote session. “UTC” is true universal
time with no local offset applied.
•
The “Momentary Loudness” graph works in exactly the same was as the “Short
Term Loudness” version but provides a more detailed view over a much shorter
period of time.


