


Chapter 12: Statistics
181
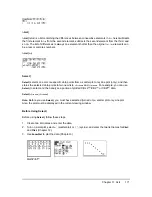
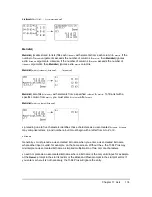
Notice that the first three residuals are negative. They correspond to the shortest pendulum string
lengths in
L1
. The next five residuals are positive, and three of the last four are negative. The latter
correspond to the longer string lengths in
L1
. Plotting the residuals will show this pattern more
clearly.
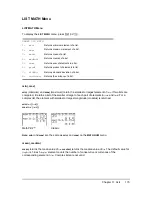
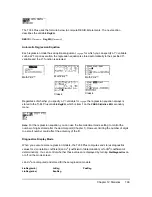
16. Press
y
9
to display the
LIST NAMES
menu.
If necessary, press
†
to move the cursor onto the
list name
RESID
.
17. Press
Í
to select
RESID
and paste it to the
stat list editor’s
Name=
prompt.
18. Press
Í
.
RESID
is stored in column 3 of the
stat list editor.
Press
†
repeatedly to examine the residuals.
19. Press
y ,
2
to select
2:Plot2
from the
STAT PLOTS
menu. The stat plot editor is
displayed for plot 2.
20. Press
Í
to select
On
, which turns on plot 2.
Press
† Í
to select
"
(scatter plot). Press
† y d
to specify
Xlist:L1
for plot 2. Press
†
ã
R
ä
ã
E
ä
ã
S
ä
ã
I
ä
ã
D
ä
(alpha-lock is on) to specify
Ylist:RESID
for plot 2. Press
† Í
to select
›
as the mark for each data point on the scatter plot.
21. Press
o
to display the Y= editor.
Press
|
to move the cursor onto the
=
sign, and
then press
Í
to deselect
Y1
. Press
} Í
to
turn off plot 1.
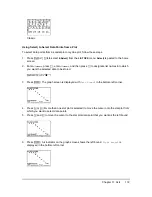
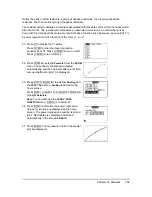
22. Press
q
9
to select
9:ZoomStat
from the
ZOOM
menu. The window variables are adjusted
automatically, and plot 2 is displayed. This is a
scatter plot of the residuals.


