Prism6 & Crystal Reader software User Manual
35
By dragging & dropping in the histogram with the left mouse button, you can set the
minimum and maximum intensity cursors and draw an interval. The pixels with RFU
values included in this interval will be highlighted in orange color in the chamber image.
In the following example, we select the interval 24576-37632 RFU, which reveals the
positive droplet population:
This tool helps to detect time exposure issues and provides an indication of separability
between the negative and positive droplet populations.
o
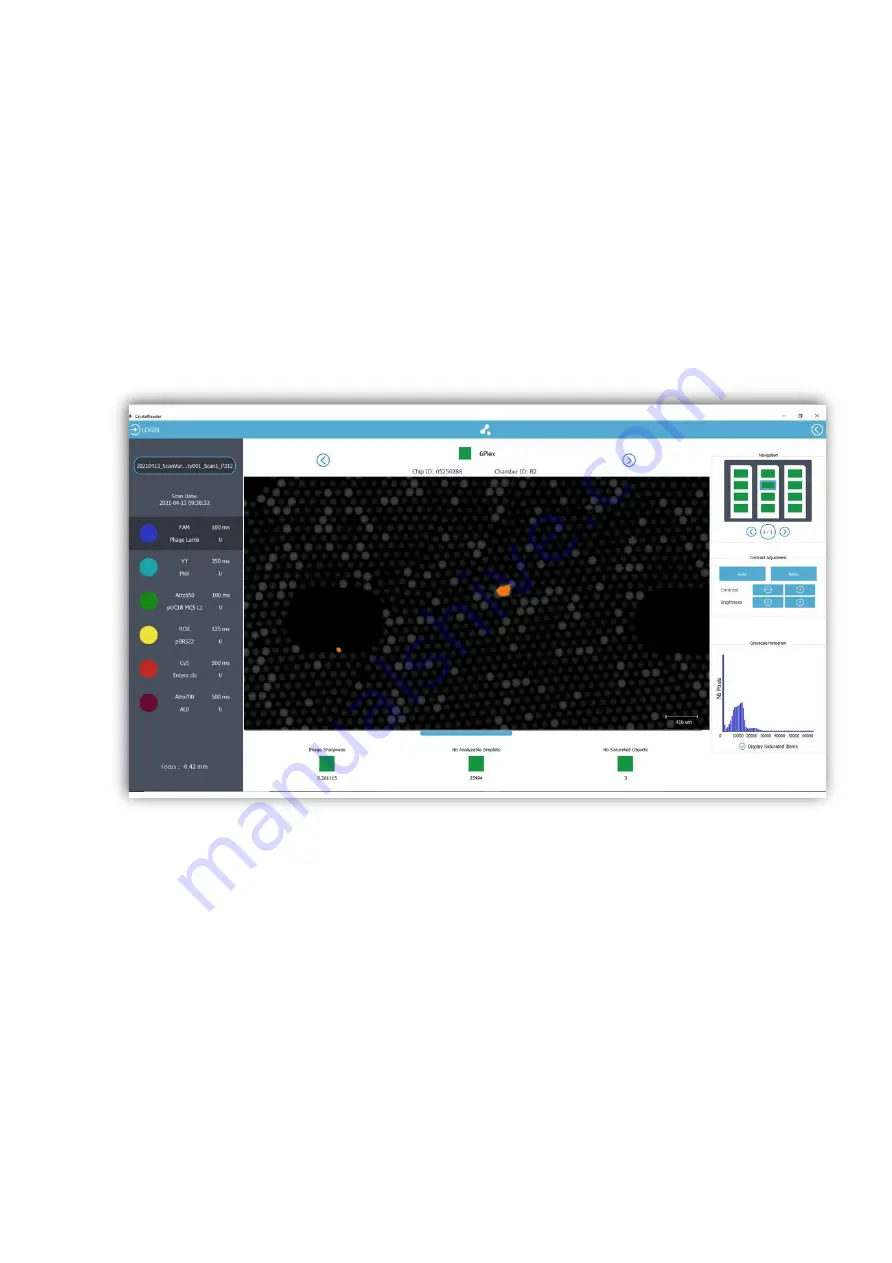
Check the saturated objects in each detection channel by checking the box “Display
Saturation Map”. The saturated pixels are displayed in orange color:
Figure 24: Overlay of the saturation map in the Blue detection channel in the Crystal Reader
software (saturated pixels are displayed in orange color). In this case, it is a dust particle.
CAUTION!
Ensure that all the pixels located in the droplets are not saturated in any channel,
otherwise, the saturated droplets will be considered as not analyzable by the software and
will be rejected from the analysis. If necessary, decrease the exposure time of the channel
and rescan the chamber.
o
Perform quality control:
The quality flags are automatically computed and provided at 2 levels:
•
Chamber level: the chamber flag corresponds to the worst quality flag at the
criterion level, among the criteria computed for the chamber.
•
Criterion level: 3 specific flags are used.
▪
“Image Sharpness”: the higher the score the better the sharpness in
chamber images.
Note: A yellow flag may be caused by an out-of-focus issue (this can be


