65
Tel: 886.2.2175 2930 Email: [email protected]
enabled.
Smoothing spots are displayed when smoothing function is enabled.
TRANSFORM:ON is displayed when time domain transformation function is enabled.
GATE:ON is displayed when gate function is enabled.
GP-IB condition: LOCAL or REMOTE
Clock reference signal condition: INT or EXT
4.9.1.1.
Triggering of status bar display
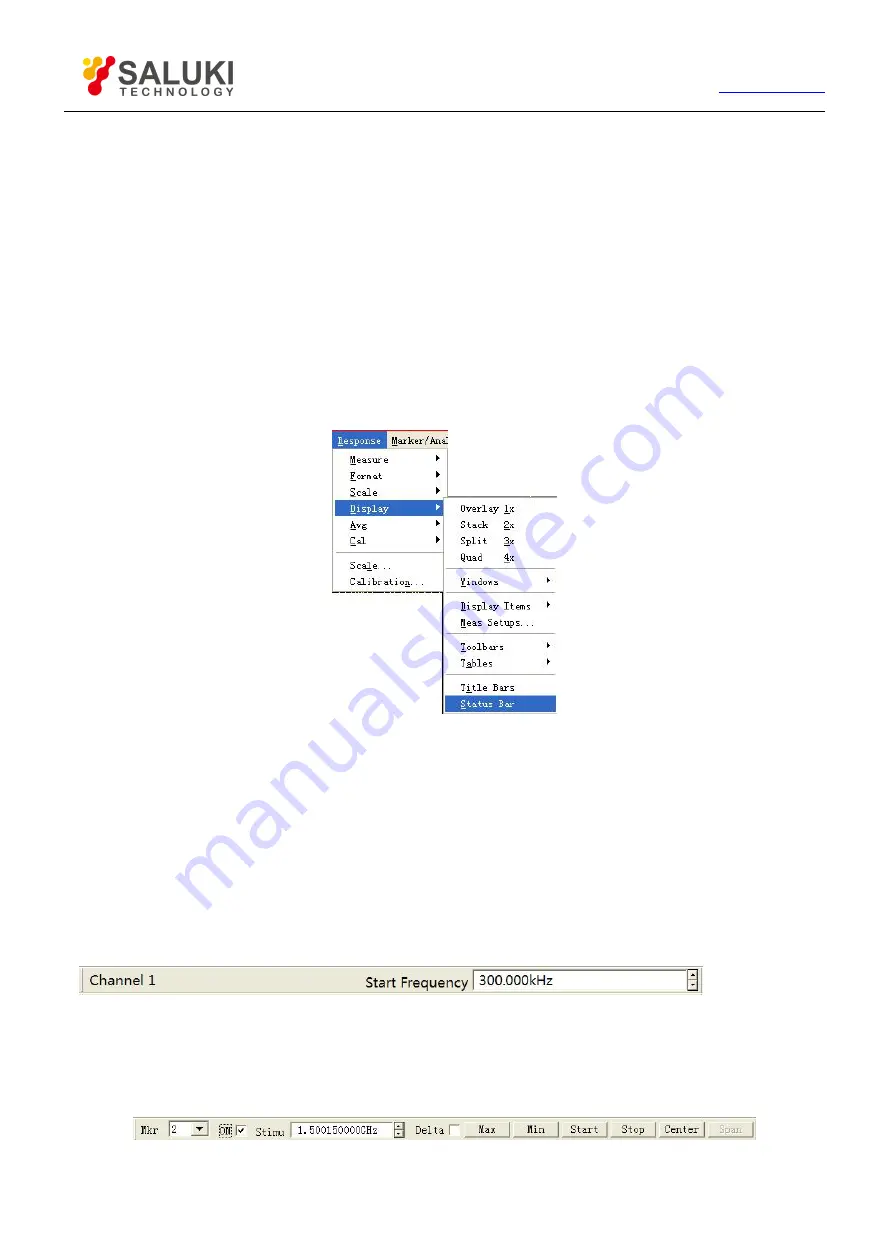
By mouse or touch screen
Click [Response] once, point at [Display] on dropdown menu to get the submenu, click and tick [Status bar] to enable status bar
display, and remove the tick to close status bar display.
Figure 4-31 Triggering of Status Bar Display
By front panel keys
1) Press
【
Display
】
in RESPONSE area, the corresponding soft-key tool bar turns up, and press soft-key corresponding to
[More].
2) Press soft-key corresponding to [Status bar on/OFF] in the displayed soft-key tool bar to enable the status bar display.
4.9.2.
Tool Bar
The Analyzer can simultaneously display 6 different tool bars at most, and it is quite easy to set up Measure by the tool bar.
Active input tool bar
The active input tool bar is displayed at the top of screen and under the menu bar; press different Utility keys on the front panel,
different active input tool bars will be displayed, and it is feasible to input corresponding numerical value if names of tool bars
correspond to names of keys.
Marker tool bar
The marker tool bar is used to set up and modify marker, as well as change Analyzer setup. By the marker tool bar, it is feasible to


