60
Tel: 886.2.2175 2930 Email: [email protected]
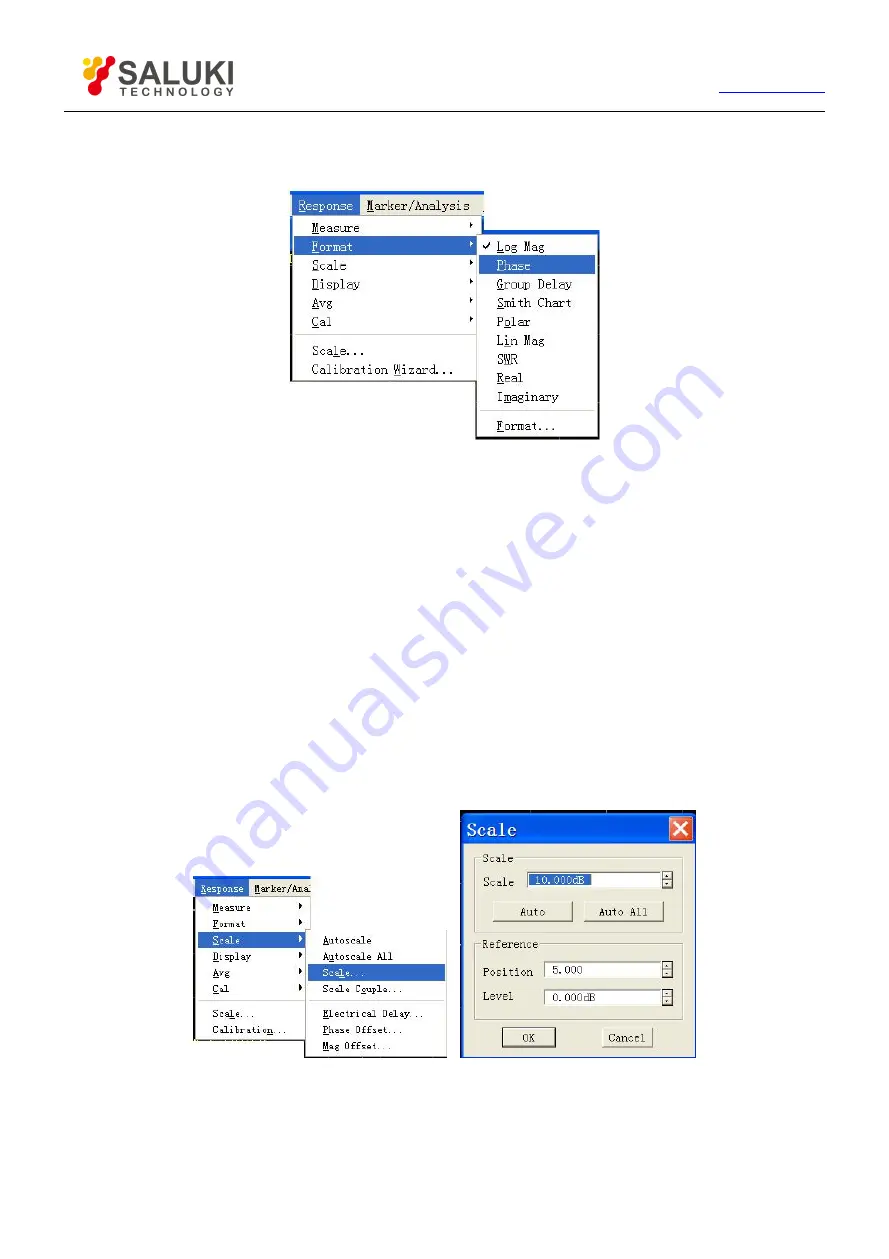
1) Click [Response] and point to [Format] in Response menu to show the submenu of Format.
2) Select the format needed in the submenu.
Fig. 4-26 Data Format Settings
By front panel keys
1) Press
【
Format
】
key in RESPONSE area to show corresponding soft-key toolbar.
2) Press the corresponding soft-key to select the format needed.
4.7.3.
Scale
Scale is used to set the scale of the vertical part of grid shown. In Polar coordinate format or Smith Chart format, it is used to set the
full scale of the outer circle. The scale and format settings determine the display mode of measuring data on the screen. In
Logarithmic format, the scale setting range is: 0.001dB/grid~500dB/grid.
4.7.3.1.
By mouse or touch screen
1) Click [Response], point to [Scale] in Response menu to show submenu. Click [Scale...] to show Scale dialog box.
2) Click the corresponding input zone or button to set suitable scale, reference position and reference value.
3) After setting, click [OK] button to close the dialog box.
Fig. 4-27 Scale Settings
4.7.3.2.
By front panel keys
1) Press
【
Scale
】
in RESPONSE area to show corresponding soft-key toolbar.
2) Press the soft-key corresponding to [Autoscale ] and Analyzer will set automatically suitable scale and reference level.


