34
Promega Corporation · 2800 Woods Hollow Road · Madison, WI 53711-5399 USA · Toll Free in USA 800-356-9526 · 608-274-4330 · Fax 608-277-2516
TM397 · Revised 12/16
www.promega.com
3.D. ‘Results’ Screen (continued)
11
654T
A
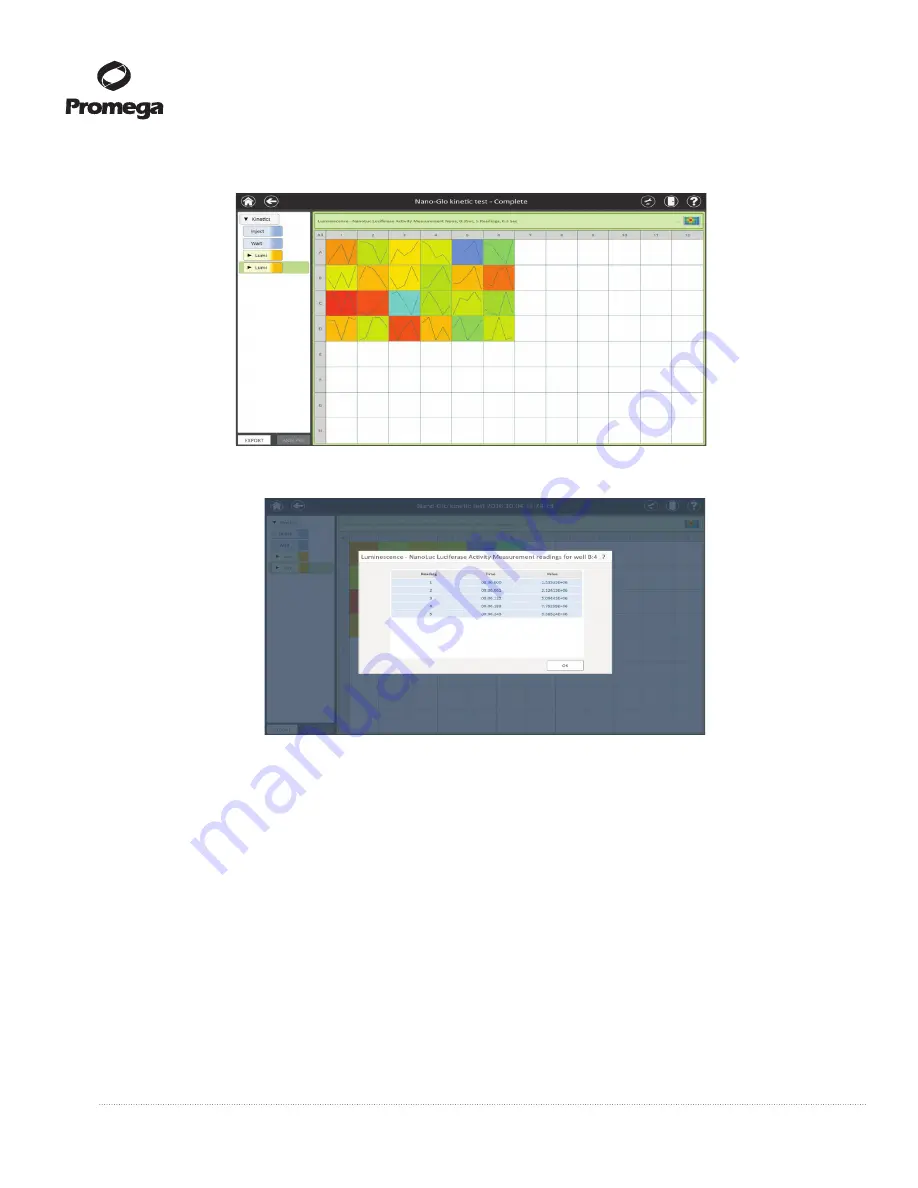
Figure 38. Example of ‘Results’ screen for kinetic data.
11
653T
A
Figure 39. Example of individual well result for kinetic data.
3.
Once a read is complete, the ‘Results’ screen will appear (see Figures 37 and 38).
a.
To analyze data, tap the
Analysis
button (bottom left corner of screen in Figures 37 and 38). Analysis
functionality is described in Section 3.E. For certain result types (e.g., protocols containing kinetic
reads), the
Analysis
button will be inactive because analysis is not supported for these protocol types.
b.
To Export data, tap the
Export
button (bottom left corner of screen in Figures 37 and 38).
c.
The software will then open the Export folder that was selected in the Administrator settings (see
Section 3.F, Figure 78). Data may be exported to a number of locations, including a USB flash drive,
microSD card, the Tablet PC C:\ drive or a cloud-based storage.
d.
Two files are automatically exported: A comma-separated value file saved in a csv folder within the
export path, and a Microsoft Excel worksheet file. If creating a file for use with a LIMS, use the CSV file
and import according to your LIMS software guidelines.


