- 113 -
U.motion KNX Server Plus, Touch
Installation Manual
SHOW
Shows / Hides the graph of the corresponding energy counter
COMPARE
Shows hides the comparison values, which are calculated from the average value of the lastly
measured values
RANGE
Shows / Hides the colored area which marks the range between the minimum and maximum
values of the energy counter (in dependence of the selected time period)
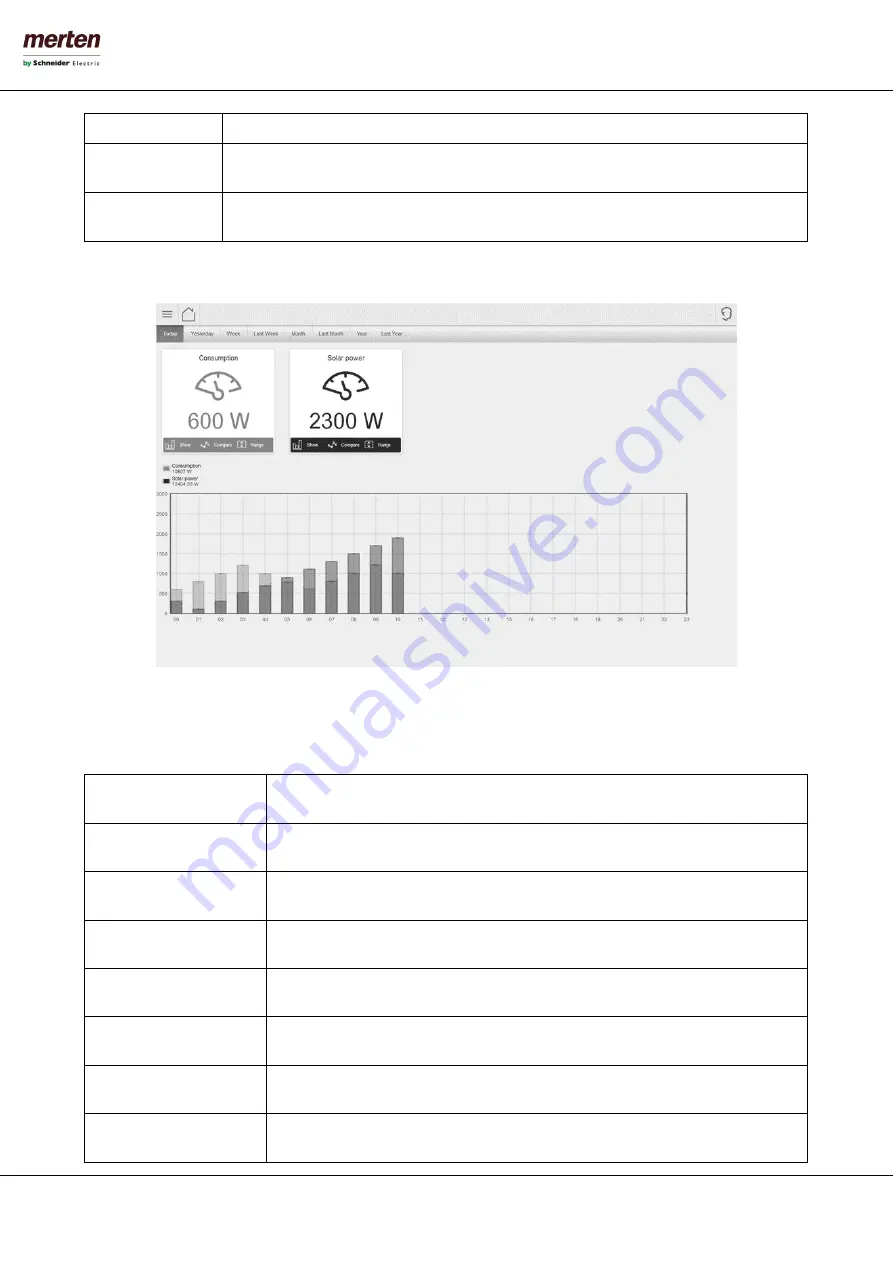
The following screenshot shows an example, in which the options “COMPARE” and “RANGE” have been disabled; in this
case, only the real energy values are shown:
The lower area of the page contains the graphs of the single energy counters (batteries) from the upper area. The data
shown in the graphs always refers to a certain time period, which can be selected by the user through the different TABS
on the top of the page:
TODAY
Data of the current day (from 00:00); the comparison value – if enabled – is calculated
from the average of the daily values logged
YESTERDAY
Data of the previous day; the comparison value – if enabled – is calculated from the
average of the values logged the previous day
WEEK
Data of the current week (from Monday, 00:00); the comparison value – if enabled – is
calculated from the average of the weekly values logged
LAST WEEK
Data of the previous week; the comparison value – if enabled – is calculated from the
average of the values logged the previous week
MONTH
Data of the current moth (from the first day, 00:00); the comparison value – if enabled – is
calculated from the average of the monthly values logged
LAST MONTH
Data of the previous month; the comparison value – if enabled – is calculated from the
average of the values logged the previous month
YEAR
Data of the current year (from the first day, 00:00); the comparison value – if enabled – is
calculated from the average of the yearly values logged
LAST YEAR
Data of the previous year; the comparison value – if enabled – is calculated from the
average of the values logged the previous year


