


59
SF
6
Data
Data from the
OPTI
mizer
2
can call attention to potential
SF
6
gas leaks; long before critical gas levels are reached.
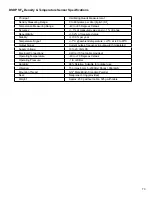
• SF
6
DENSITY indicates the dielectric strength of
the insulating gas. As density decreases, dielectric
strength decreases.
• SF
6
TREND indicates the rate of gas loss averaged
over a 15 day period. A negative trend value
indicates gas loss. This trend may fluctuate positive,
then negative, back and forth a small amount, due
to the effects of temperature changes. If it shows a
consistent negative value, this is a good indication
that the SF
6
may be leaking.
• CONFIDENCE LEVELS indicate the statistical
validity of the SF
6
trends. A combination of two
things affects the Confidence Level value: the
amount of data collected and the linearity of the SF
6
density data.
o
It takes one full time period (15 days) to collect
enough SF
6
data to have a high Confidence
Level in the trend calculation. Until the full array
of data is collected, the Confidence Level will be
lower.
o
If the SF
6
data has significant variation, the
Confidence Level will be lower. If the SF
6
data
is very consistent, the Confidence Level will be
higher. Low Confidence Levels, after the full
time period has passed, indicate fluctuations in
the SF
6
measurements. This can be caused by
temperature differences between the SF
6
density
sensor and the SF
6
vessel itself. Another cause
of fluctuations in the SF
6
measurements could
be a sensor malfunction.
• The LOW GAS ALARM FORECAST is a prediction
(based upon the most recently calculated SF
6
trend)
of how many days before the SF
6
reaches the Low
Gas Alarm Limit. This forecast aids in scheduling
and prioritizing of maintenance resources.


