Statistics
Historical performance graphs for the following items:
•
Network I/O (MB/s)
•
Disk I/O (MB/s)
•
CPU usage (%)
•
Memory usage (%)
On each graph, the X-axis represents time and the Y-axis represents performance.
Use the
Statistics
menu to select the servers to monitor (up to two), to change the maximum
value for the Y-axis, and to show or hide resource usage distribution for CPU and memory.
Recent Events
The most recent cluster events. Use the
Recent Events
menu to select the type of events to display.
You can also access certain menu items directly from the Cluster Overview. Mouse over the
Capacity, Filesystems or Segment Server indicators to see the available options.
Navigator
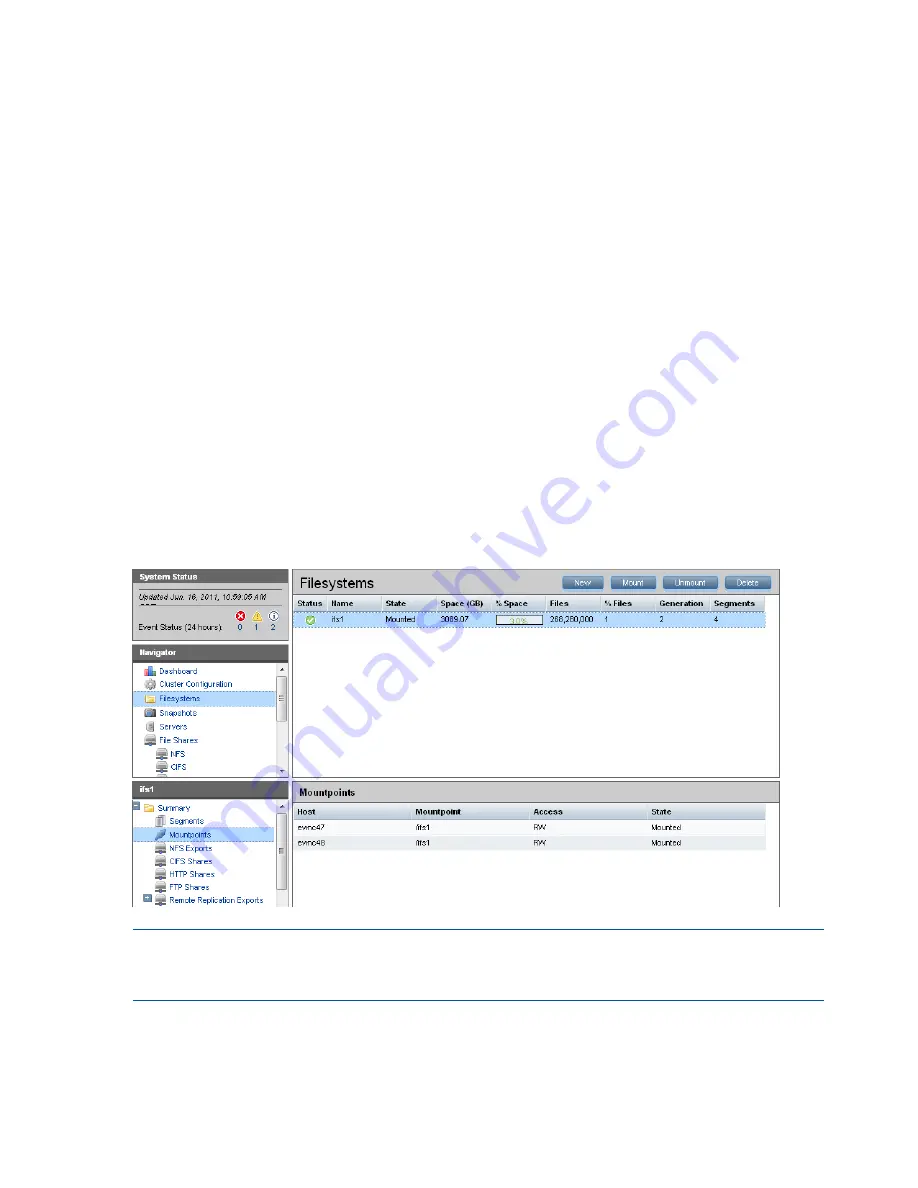
The Navigator appears on the left side of the window and displays the cluster hierarchy. You can
use the Navigator to drill down in the cluster configuration to add, view, or change cluster objects
such as file systems or storage, and to initiate or view tasks such as snapshots or replication. When
you select an object, a details page shows a summary for that object. The lower Navigator allows
you to view details for the selected object, or to initiate a task. In the following example, we selected
Filesystems in the upper Navigator and Mountpoints in the lower Navigator to see details about
the mounts for file system
ifs1
.
NOTE:
When you perform an operation on the GUI, a spinning finger is displayed until the
operation is complete. However, if you use Windows Remote Desktop to access the GUI, the
spinning finger is not displayed.
Customizing the GUI
For most tables in the GUI, you can specify the columns that you want to display and the sort order
of each column. When this feature is available, mousing over a column causes the label to change
color and a pointer to appear. Click the pointer to see the available options. In the following
32
Getting started


